Source analytics
See which knowledge sources, pages and files the assistant actually cites in its answers, how often, and which questions sent it there.
Admin → Source Analytics answers a single question: which parts of our knowledge are actually being used? Every time the assistant answers with citations, those citations are recorded on the answer. This page counts them, groups them by source, and lets you read the exact questions that pulled each source into an answer.
It is the usage side of the material you set up in Knowledge sources and Workspace files — a synced site that never gets cited is a candidate for removal, and a policy document cited on half the answers is one worth keeping accurate.
Unlike Top Questions and Coverage Gaps, this is not a precomputed report. There is no Compute now button, no nightly job and no analysis model involved — the table is a live read of stored citations, so it is up to date the moment you open it and it works even when the reports on those two pages cannot run.
Prerequisites
- The
workspace:read_usagepermission — shown as Read usage & top questions when you build a group. Workspace owners and admins have it; other members need it granted. Without it the page reads "Source Analytics is restricted to admins and owners." - Chat activity in which the assistant cited something. Answers with no citations contribute nothing here, and neither does a conversation whose thread has since been deleted.
Read the table
-
Open Admin from the left navigation, then choose Source Analytics under Usage in the admin sidebar.
The page opens on Last 30 days. The counter on the left reads
N of M sources, and each row is one source: an icon (a globe for a crawled or synced web source, a document for an uploaded file), the source label, # times referenced, a % of total bar, and a View Questions action. Rows are sorted most-referenced first.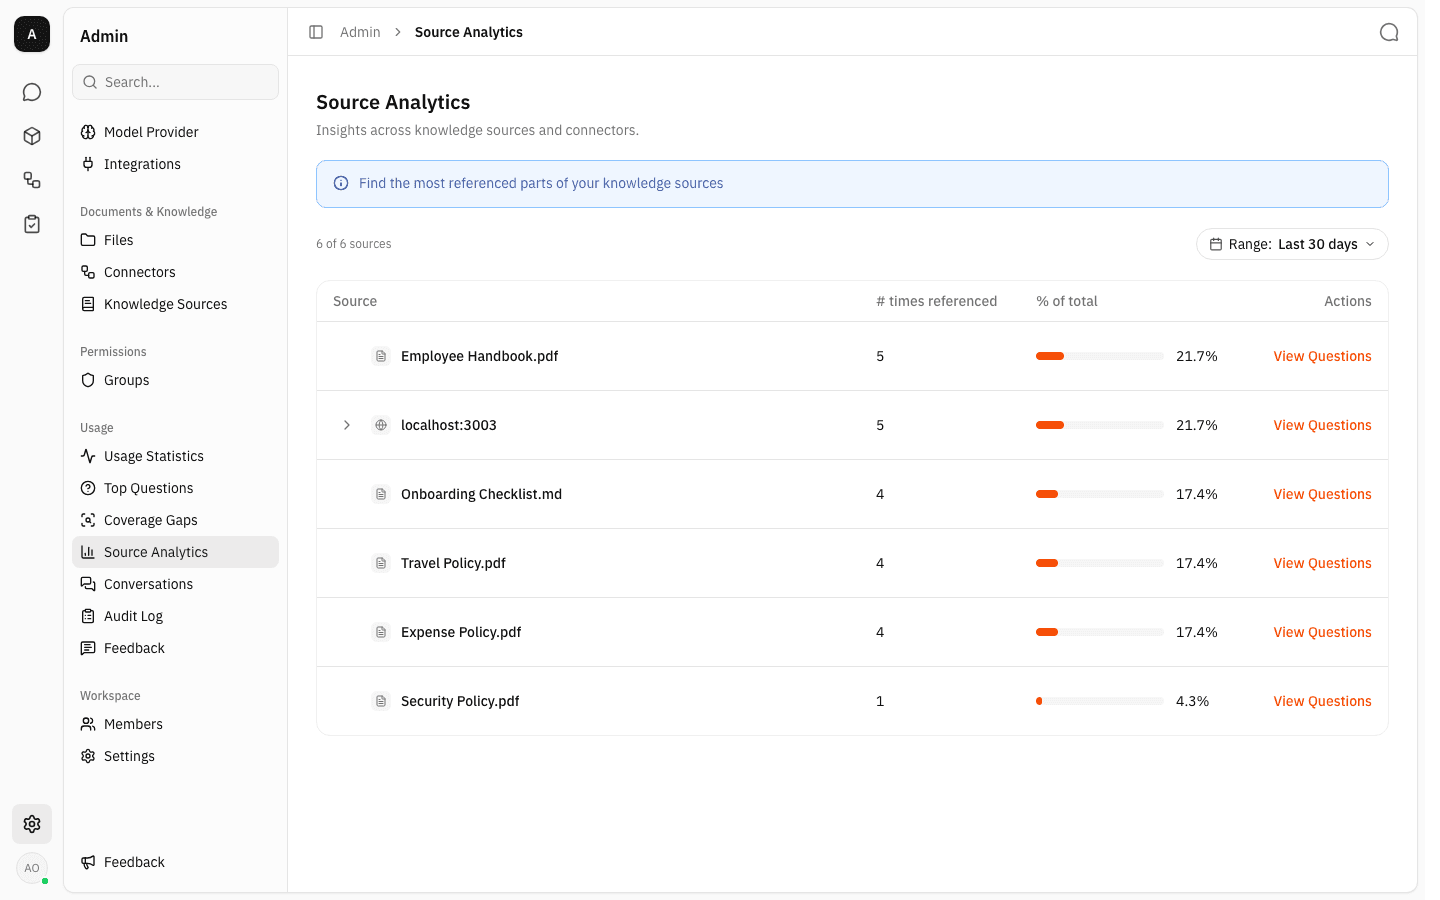
-
# times referenced counts distinct assistant answers, not citation chips. If one answer cites four passages from the same handbook, the handbook still scores 1 for that answer. % of total is that count as a share of every source's count added together, so the source percentages add up to 100%.
Two kinds of row can appear:
- Web sources are grouped by host name —
docs.example.com, orlocalhost:3003in the workspace above. Everything the assistant cited from that host rolls up into one row, whichever synced document it came from. - Files are grouped by the uploaded file itself and labelled with its file name. Grouping is by the stored file, not the name, so renaming a file keeps its history and two different uploads that happen to share a name stay apart.
- Web sources are grouped by host name —
-
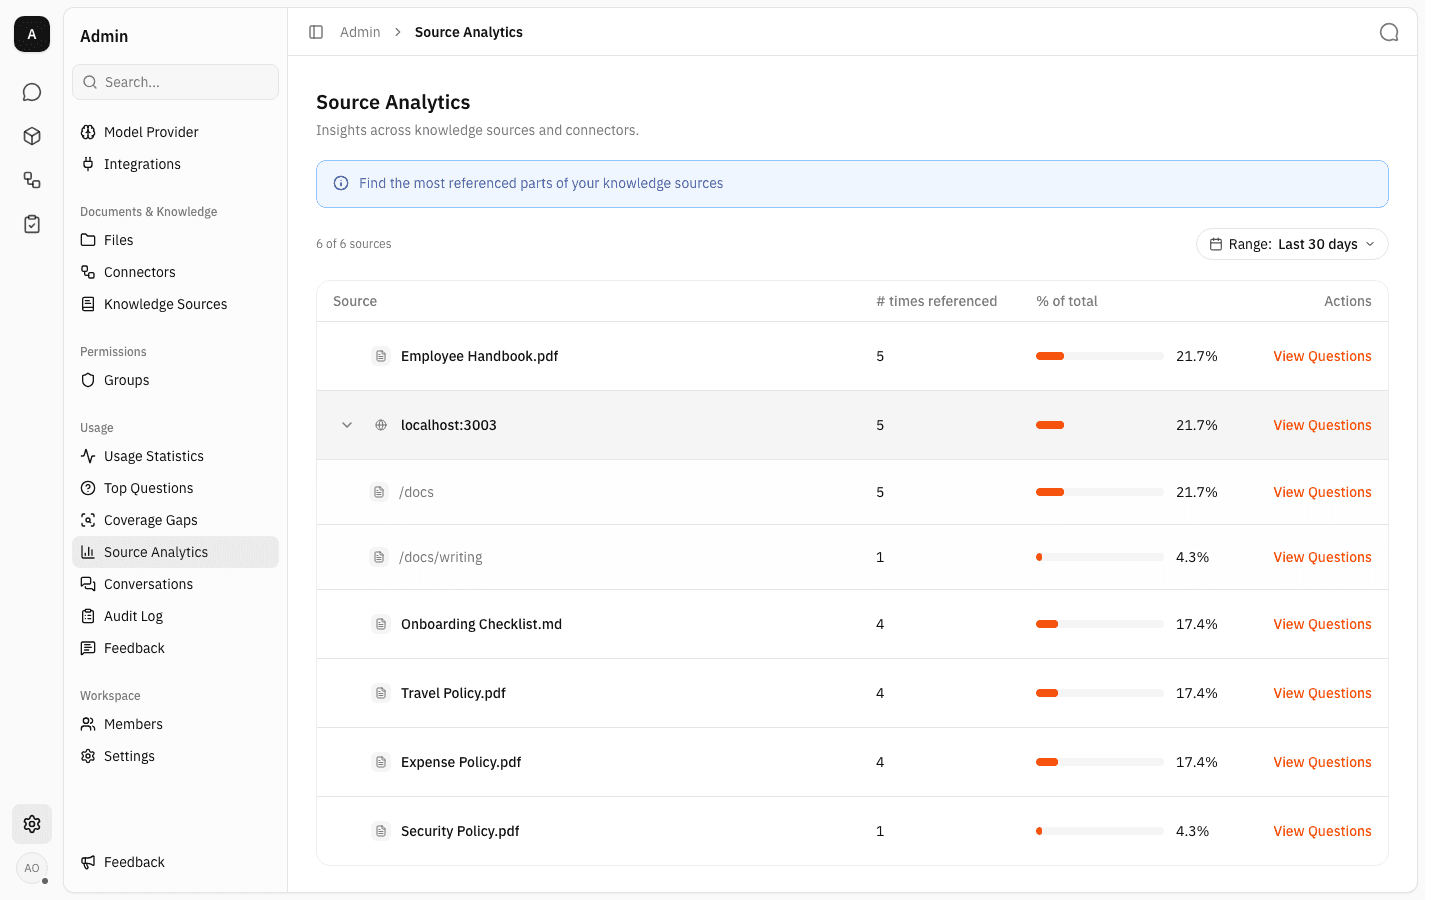
A web source with a chevron on the left can be expanded — click anywhere on the row (or press Enter with it focused) to reveal one indented row per cited page path, again sorted most-referenced first.
The page counts use the same denominator as the source counts, which is why a parent and its busiest page can show the same percentage. They also explain why the children do not have to add up to the parent: below,
/docswas cited by 5 answers and/docs/writingby 1, but the host total is still 5 — one answer cited both pages and is only counted once for the host.File rows have no chevron. An uploaded file has no page structure to break down, so it is always a single row.
-
Sources load five at a time. If the workspace has more, a Load more button appears under the table and also fires by itself as you scroll to the bottom; the
N of Mcounter tracks how many of the total are on screen.
See the questions behind a source
-
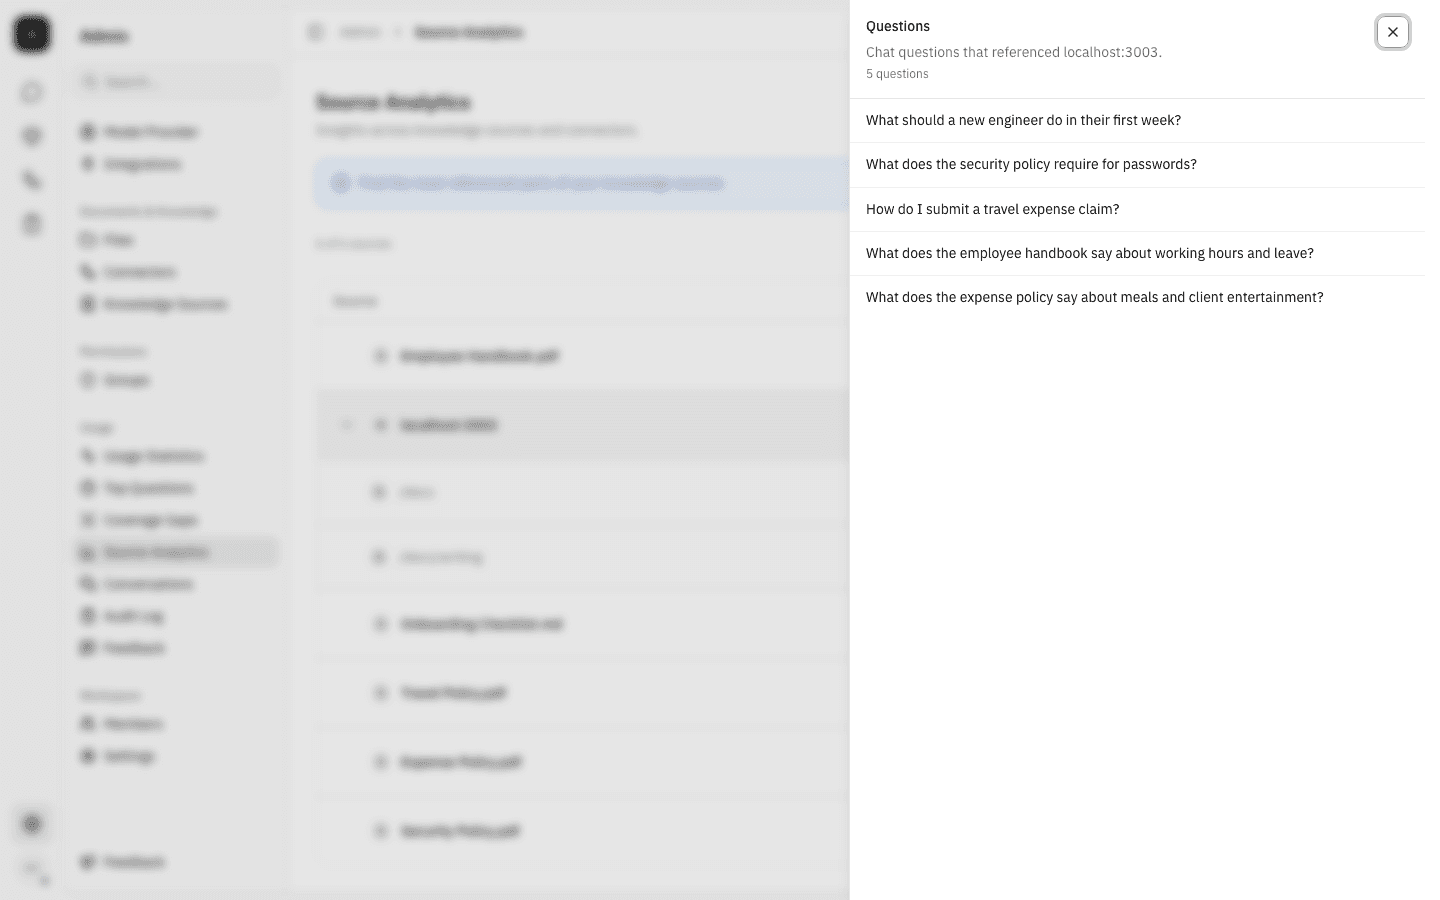
View Questions on any row opens a side sheet listing the distinct member questions whose answers cited that source, with the count underneath the heading. Repeated wording is collapsed, so the list is questions rather than occurrences. At most 100 questions are kept per source.
This is the quickest way to sanity-check a source: if the questions reaching a document have nothing to do with what it contains, the assistant is retrieving it for the wrong reasons.
-
View Questions on an expanded page row narrows the same list to that one page. The sheet's subtitle shows the full address — host plus path — so it is clear which of the two levels you are looking at.
Press
Escor the close button to return to the table.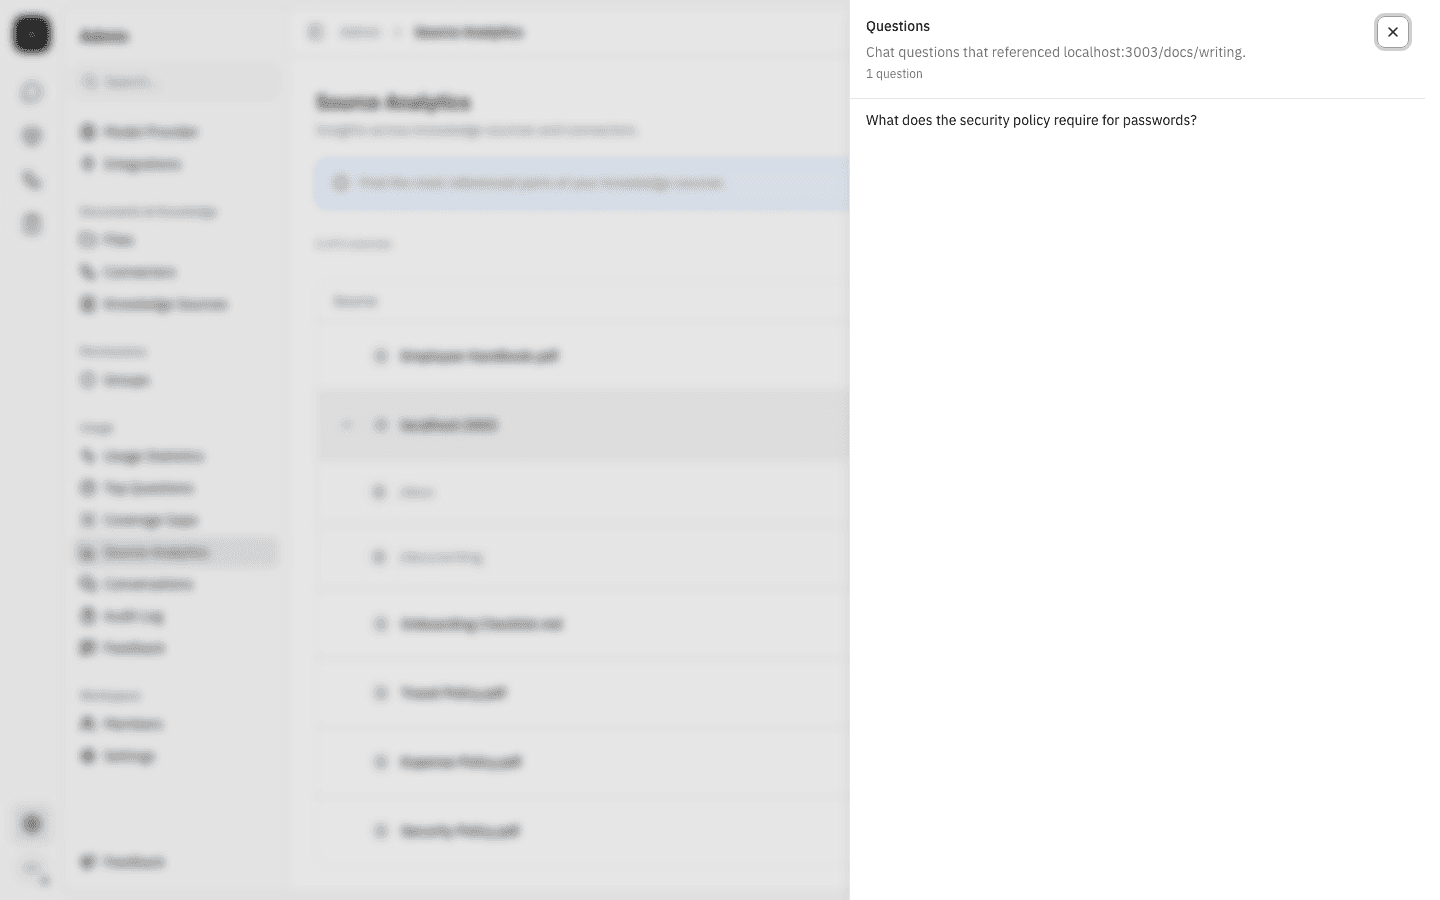
Change the time range
-
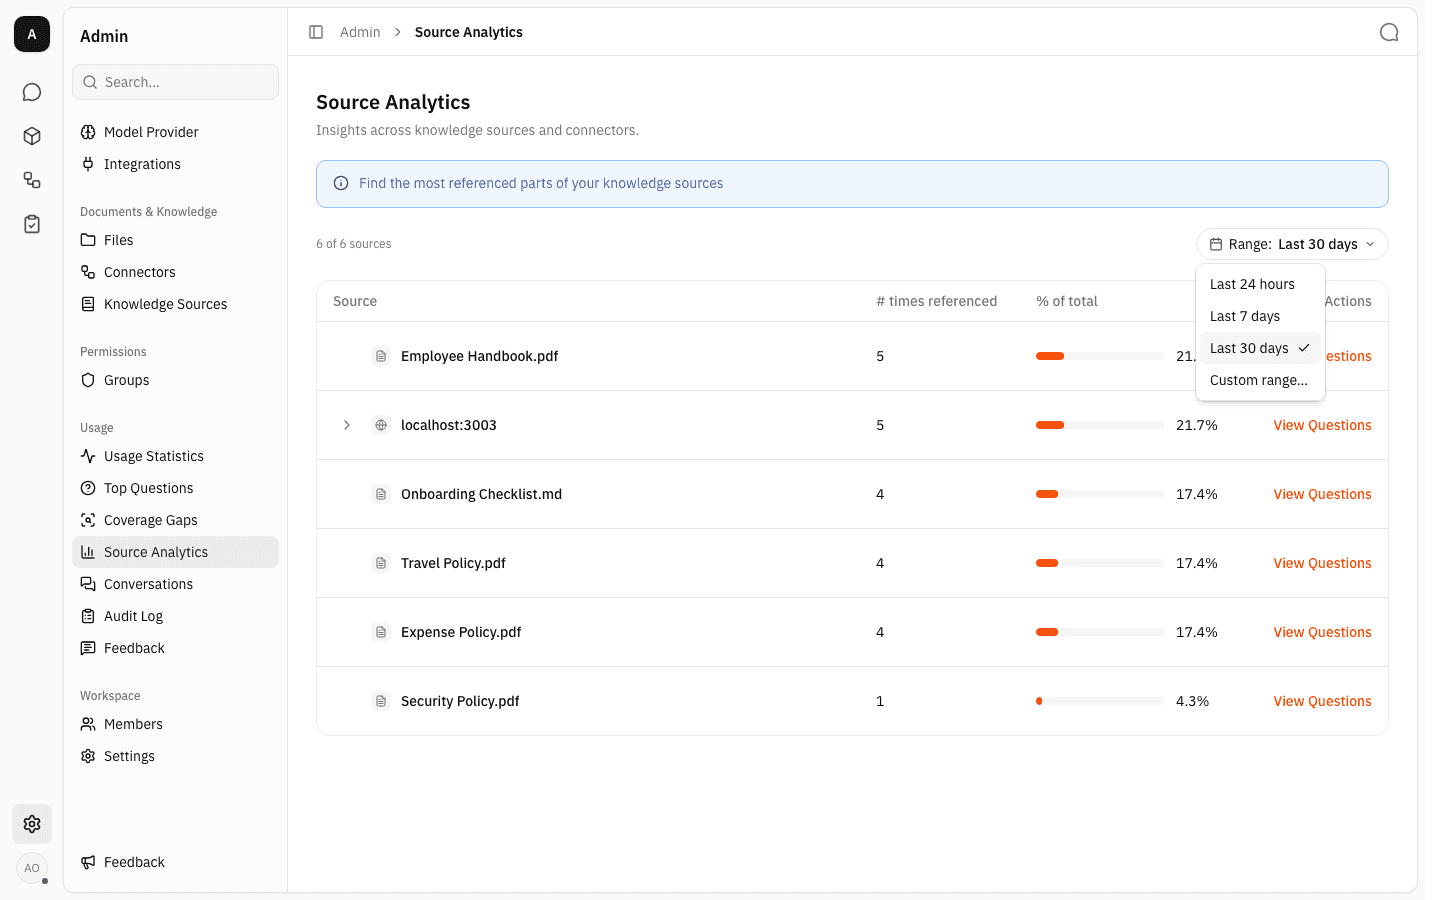
The Range chip in the top-right corner controls the window. Click it for the presets: Last 24 hours, Last 7 days, Last 30 days (the default, and the only value that leaves the chip unhighlighted) and Custom range…. The window filters on when the answer was given, not when the source was added or last synced.
-
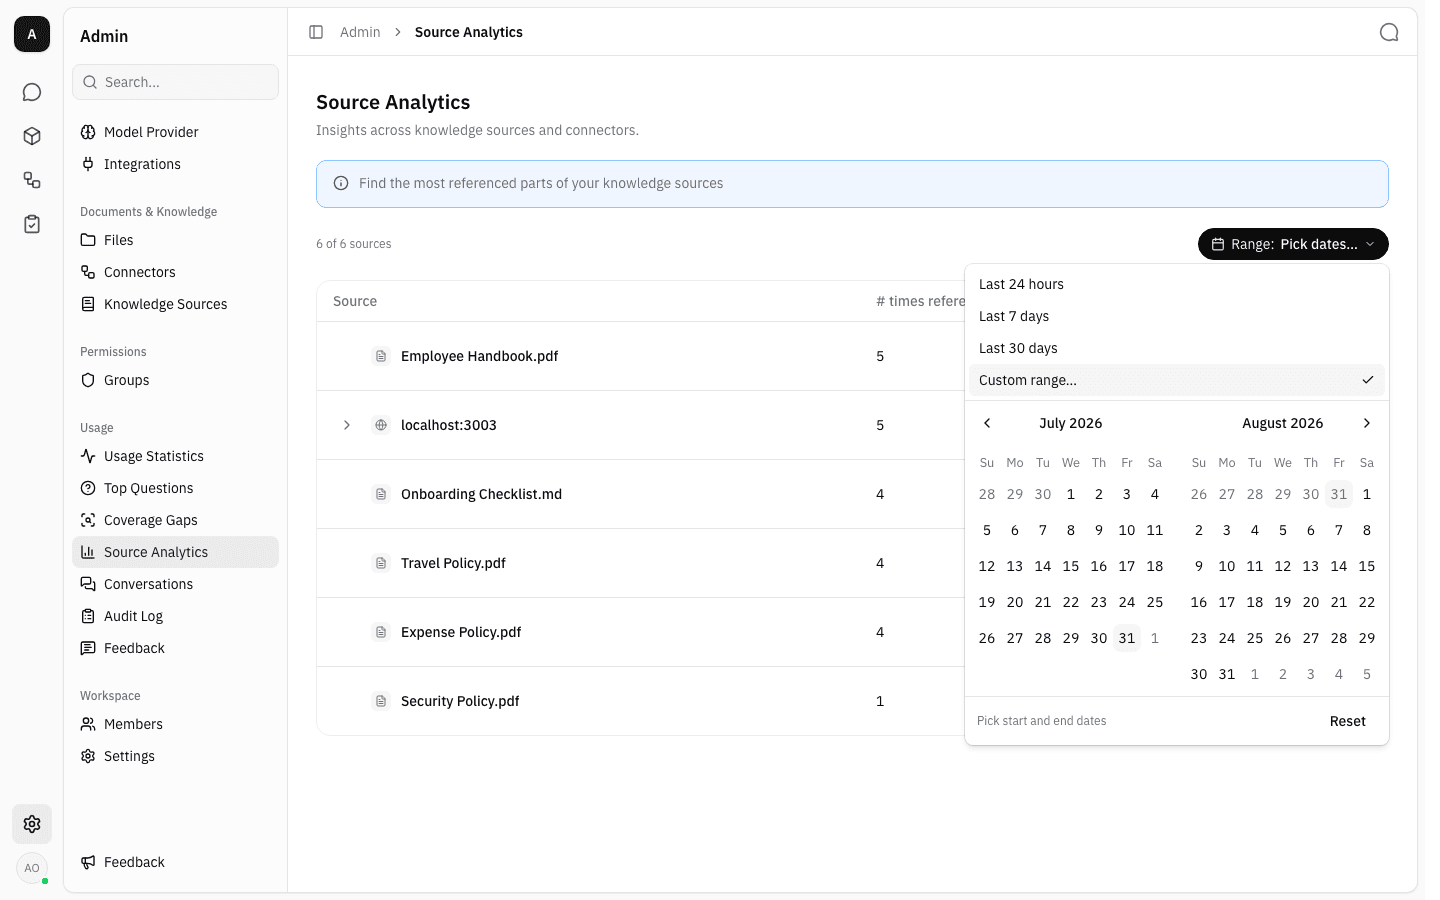
Custom range… keeps the popover open and adds a two-month calendar. Click a start date, then an end date; the end date is included in full, up to the end of that day. Reset clears the range and returns to Last 30 days.
-
Changing the range re-reads the table. The previous results stay on screen, dimmed, with a small spinner beside the counter while the new window loads, so the table never flashes empty mid-switch.
-
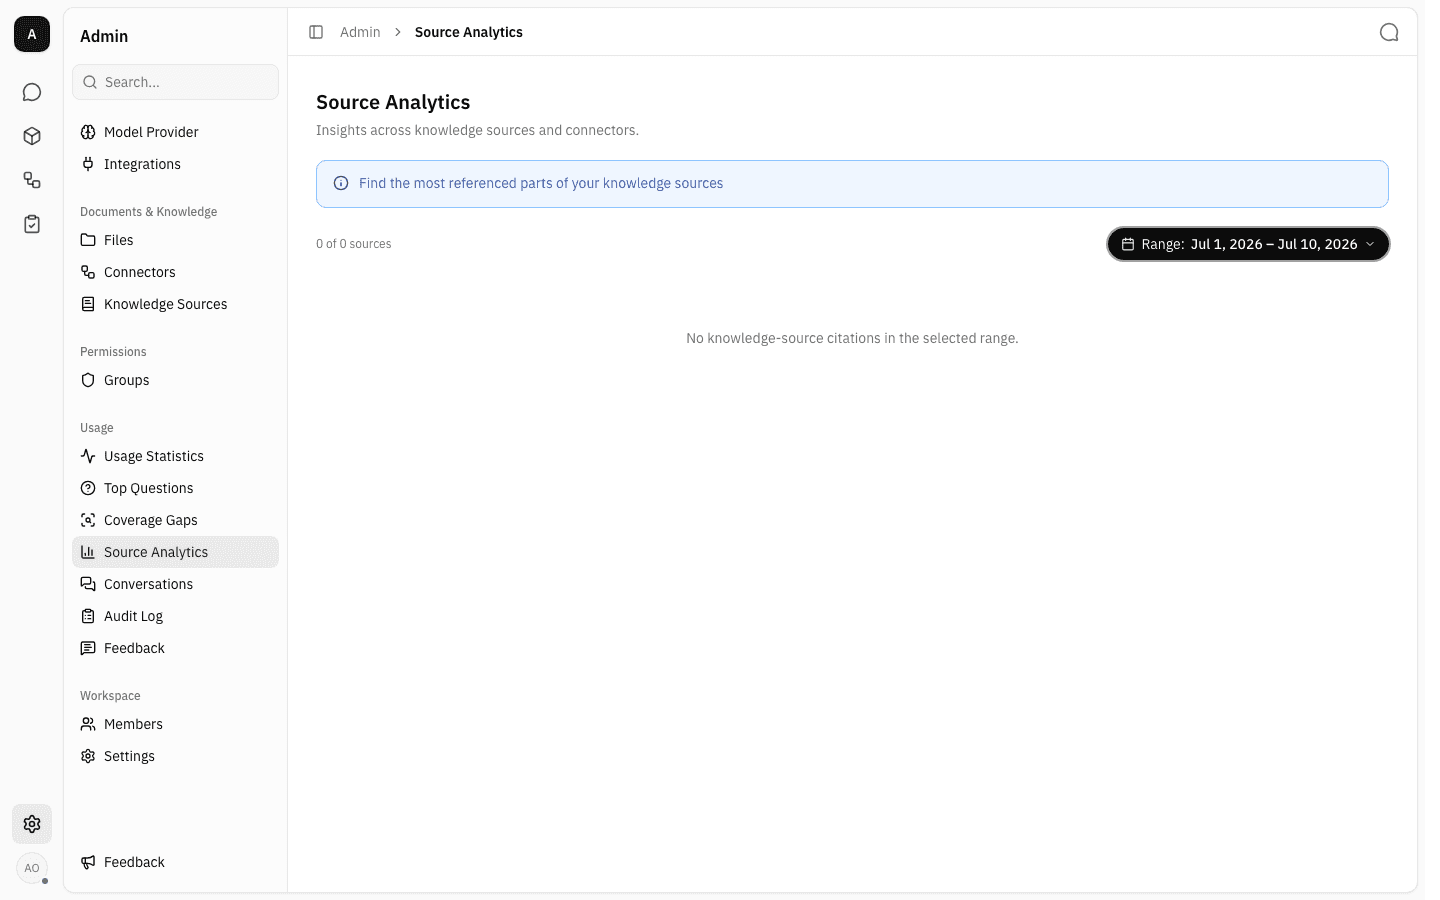
A range with no citations in it shows No knowledge-source citations in the selected range. That is also what a workspace sees before anyone has chatted, or when every answer in the window was given without citing anything.
Notes
- The range is not remembered — reopening the page starts again on Last 30 days.
- If the read fails, a red Couldn't load source analytics. banner appears with a Retry button. When earlier results are already on screen the banner sits above them and the table stays, so a transient failure does not wipe what you were reading.
- Deleting a conversation removes its citations from this page. Deleting the underlying file or knowledge source does not: past answers still cited it, so the row stays for as long as the answers do.
- The workspace in these screenshots has only five conversations, which is why the counts are single digits and only six sources appear. The layout, grouping and percentages behave the same at any volume — only the numbers grow.
- For the answers themselves rather than the sources, use Conversations; for who is chatting and how much, Usage statistics.