Usage statistics
See how much the workspace is actually being used — projects, chats, AI answers and uploaded files, month by month, plus the most active people and projects.
Admin → Usage Statistics is the adoption dashboard for a workspace. It answers "is anyone using this?" with four all-time totals, two monthly trend charts, and two leaderboards: the members who ask the most, and the projects that get chatted in the most.
It is read-only and has no filters or export — everything on the page is the whole lifetime of the workspace. For the content of what people asked, use Conversations; for what they thought of the answers, use Answer feedback. Top Questions, Coverage Gaps and Source Analytics sit beside this page in the same Usage section of the admin sidebar and cover question clustering, unanswerable questions and per-source retrieval.
Prerequisites
- The
workspace:read_usagepermission — listed as Read usage & top questions when you build a group. Workspace owners and admins have it; other members need it granted through a group. Without it the page shows "The usage dashboard is restricted to admins and owners." - Some real activity. Every number here is derived from chats people actually sent, projects they created and files they uploaded — a brand-new workspace shows zeros, empty tables and empty charts.
Read the dashboard
-
Open Admin from the left navigation, then choose Usage Statistics under Usage in the admin sidebar.
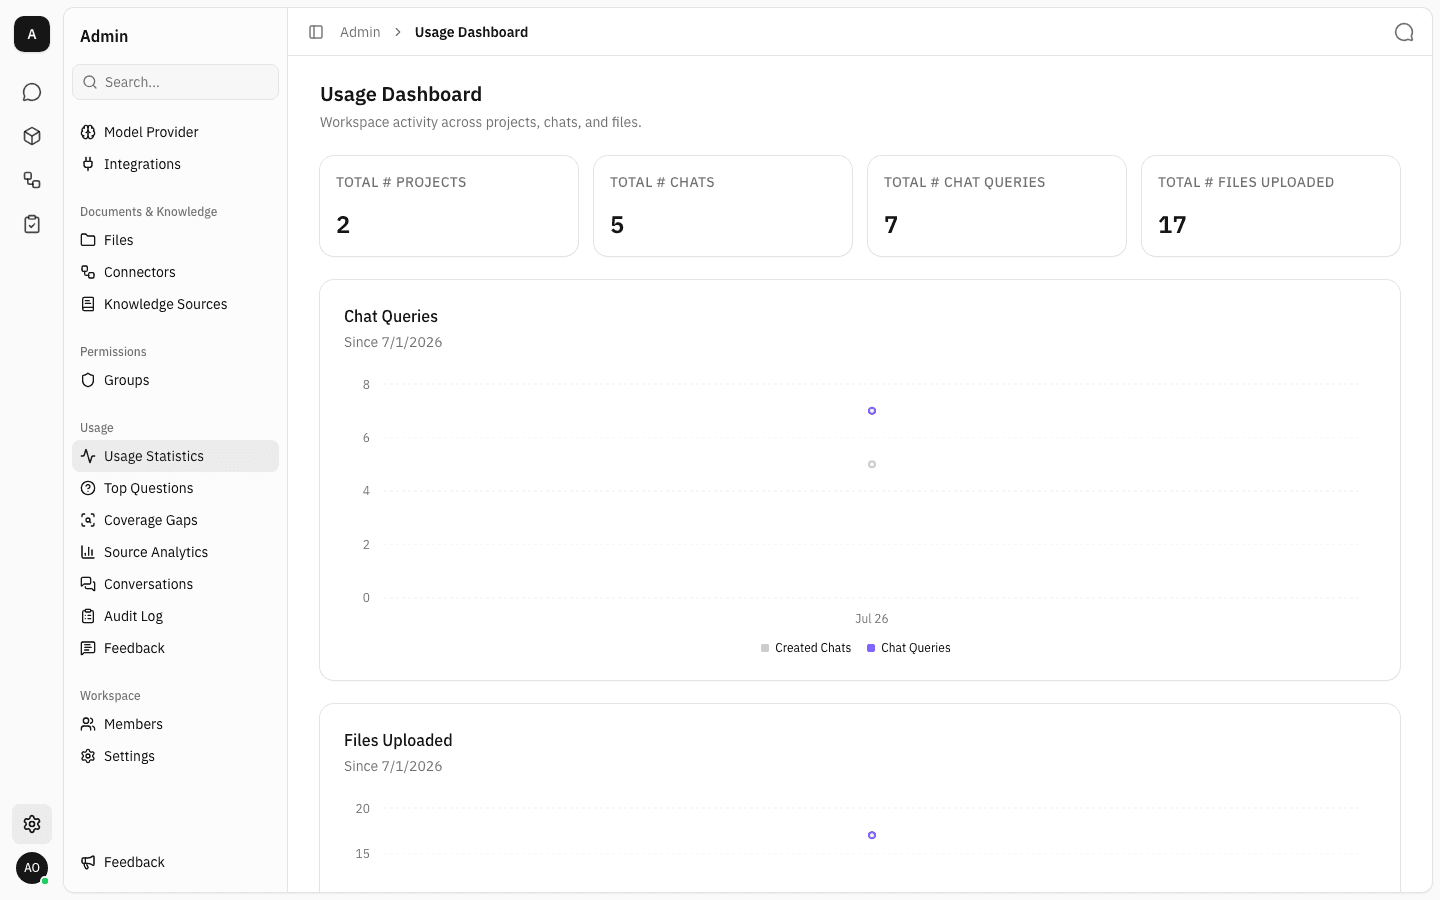
The four cards along the top are all-time counts for the whole workspace, not a rolling window:
- Total # projects — projects that currently exist. Deleted projects drop out.
- Total # chats — chat threads, both workspace-level and project chats. Threads a user deleted from their history drop out.
- Total # chat queries — AI answers produced across those threads. This, not the number of threads, is the unit of "usage" everywhere else on the page.
- Total # Files Uploaded — every file that exists in the workspace: the shared Files library, project files, and documents pulled in by knowledge source syncs. It is a file count, not storage size, and it can be much larger than what anyone uploaded by hand.
-
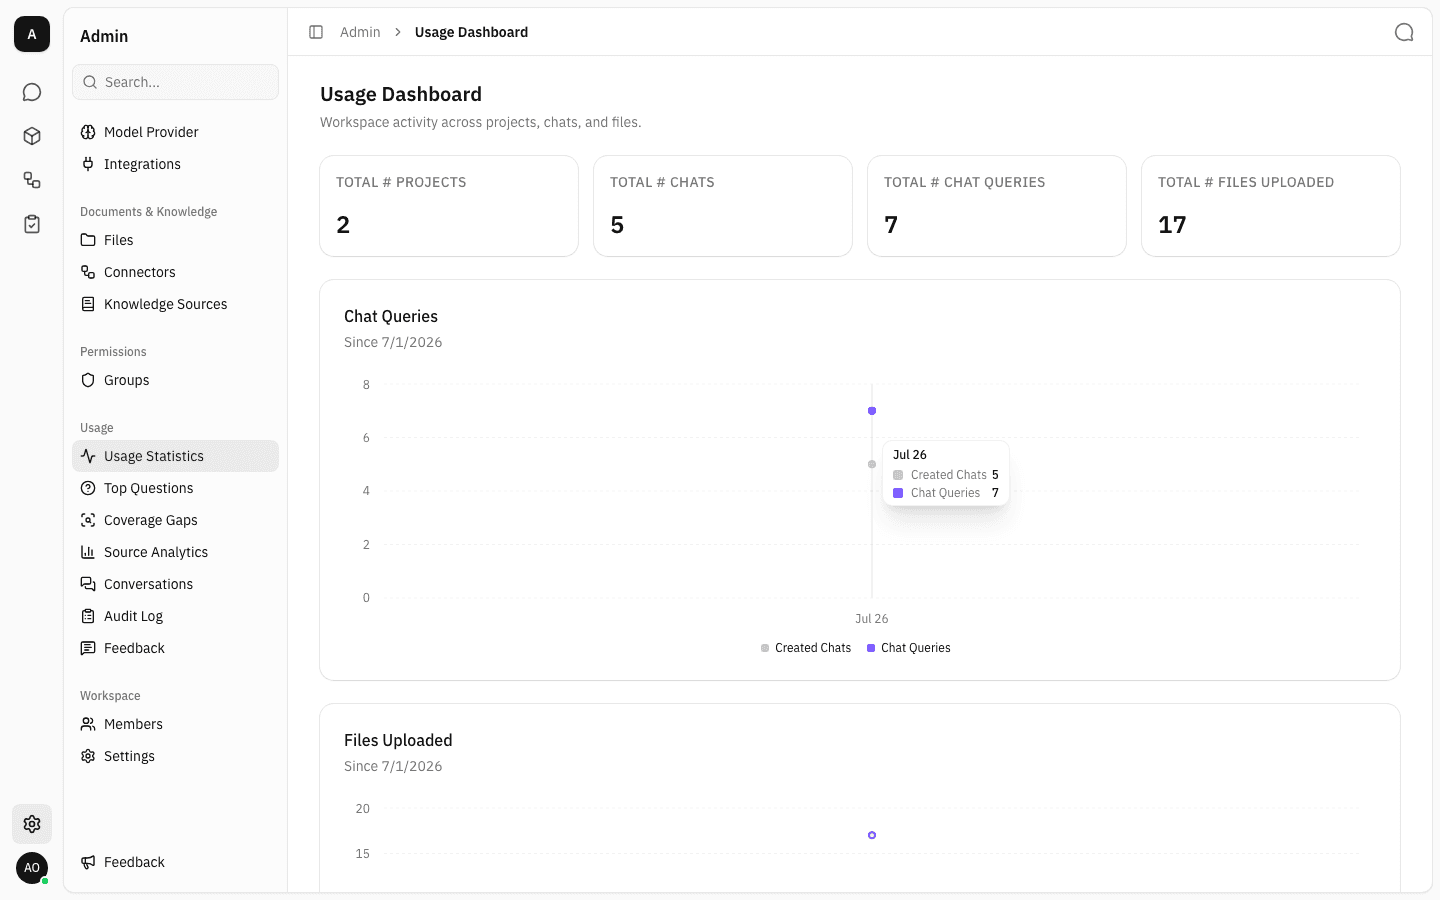
The Chat Queries chart plots two series by calendar month: Chat Queries (AI answers, purple) and Created Chats (new threads, grey). Hover any month to read both values.
The Since date under each chart title is the first month the workspace saw any activity, and the chart runs from there to the current month with empty months drawn as zero. A workspace whose activity all falls in one month — like the one below — therefore shows a single point rather than a line.
-
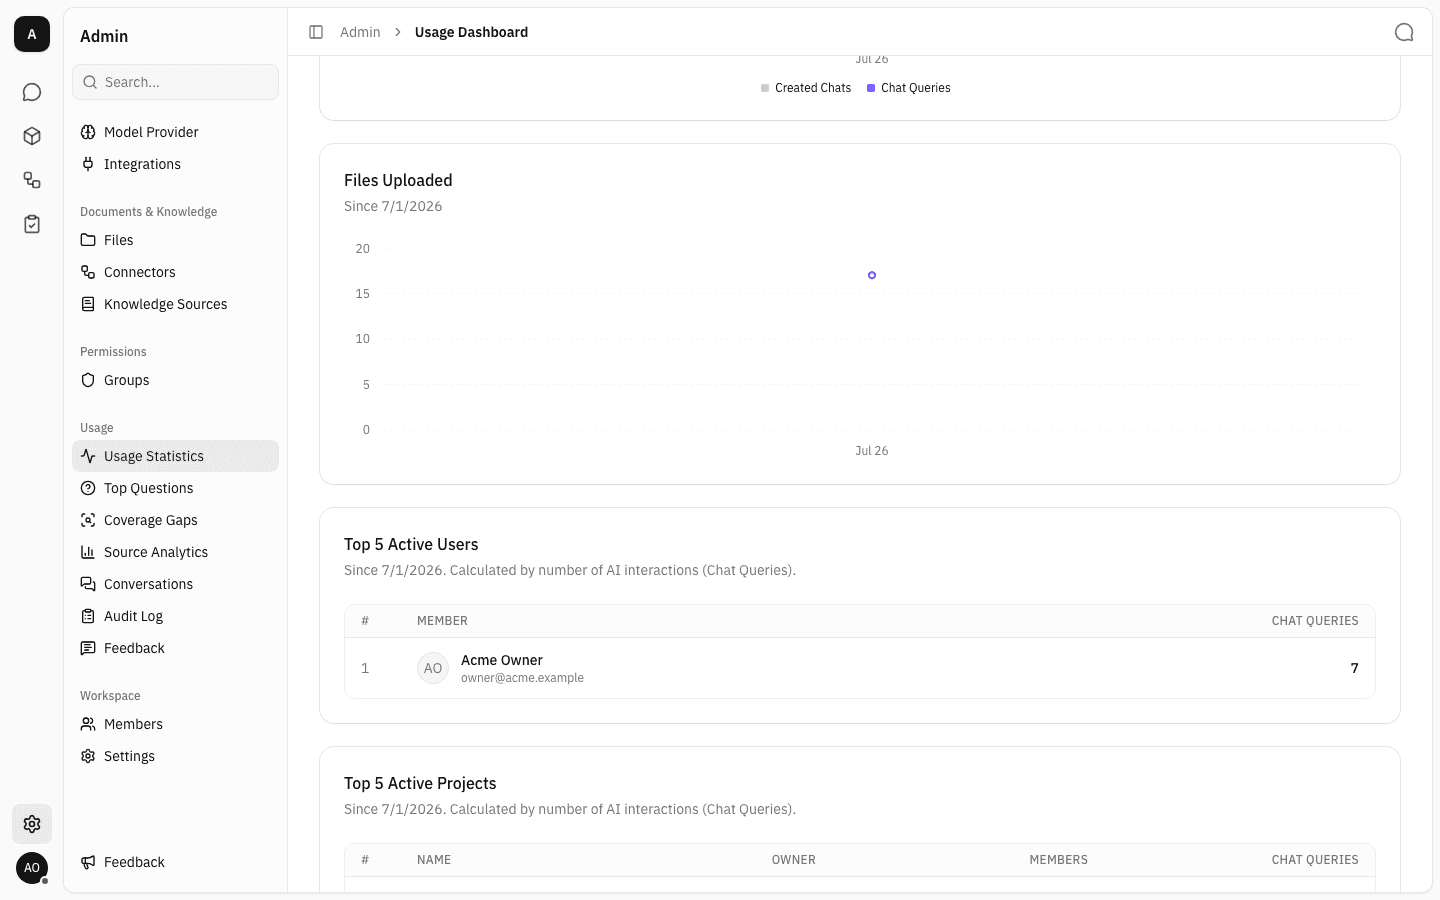
Files Uploaded is the same monthly view for files, counted by the month each file was added. A sync that imports a large batch of documents lands entirely in the month it ran, so this chart spikes on sync months as well as on manual uploads.
Read the leaderboards
-
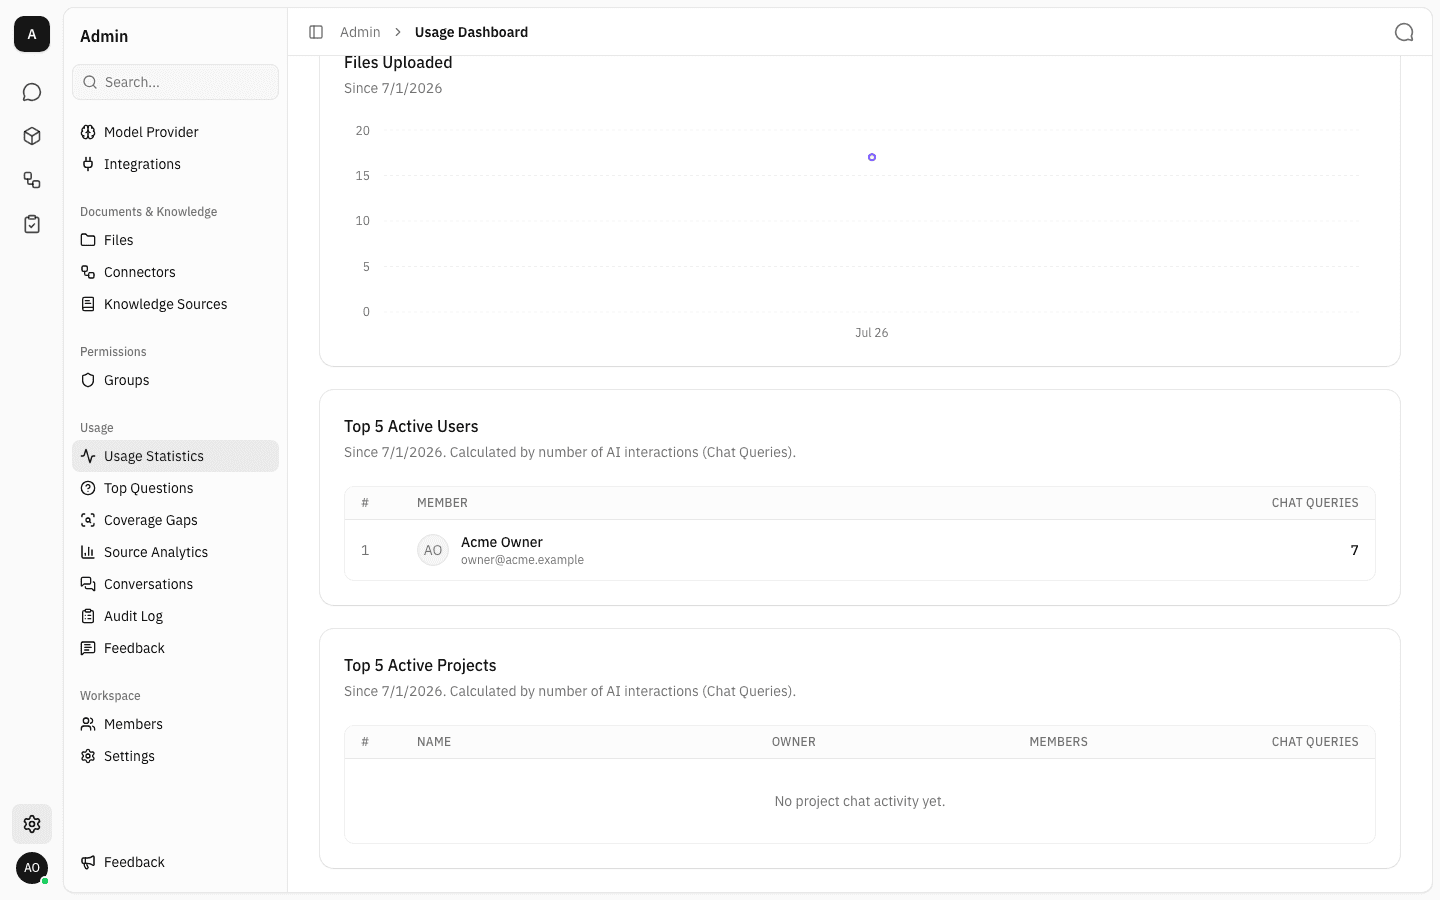
Top 5 Active Users ranks members by how many AI answers their chats produced — the same chat queries figure as the top card. Each row shows the member's avatar, name and email, and their count. Only the top five appear; there is no way to page past them or see the long tail here.
In a workspace where one person does all the asking, that is exactly what the table says. It is worth reading alongside the member list: a single-row leaderboard in a twenty-person workspace is an adoption problem, not a data problem.
-
Top 5 Active Projects ranks projects the same way, but it only counts chats that were started inside a project. Chats started from the workspace-level Chat screen belong to no project and are excluded, so a busy workspace whose people never chat inside a project shows No project chat activity yet here while the Chat Queries card is well above zero — which is the case below.
-
When projects do have activity, each row carries Name, Owner, Members and Chat Queries. The Members cell shows up to three member avatars; a project that has no explicit members — one shared with everyone in the workspace — shows an amber ∞ badge labelled Everyone instead.
Notes
- Everything is all-time. There is no date-range picker, no per-member drill-down and no CSV export; the charts are the only way to see change over time.
- Months are bucketed in UTC, so activity late at night in your timezone can land in the next month's bucket.
- The page caches its numbers for about a minute. A chat you just sent may not be counted until you reload.
- Deleting a chat, project or file removes it from these counts retroactively — the totals describe what exists now, not everything that ever happened.
- If the data cannot be loaded the page shows "Could not load usage data. Please try again." in place of the dashboard; reloading is the fix.
Answer feedback
Review the thumbs-up and thumbs-down ratings employees left on AI answers, filter them by rating, reason and date, and export them as CSV.
Top questions
See the topics your workspace asks about most — chat questions grouped into themes by an analysis model, recomputed nightly for the current week, month or quarter.