Workspace Audit Log
Review every event recorded across the workspace, filter it by date, category, event type or actor, and export the result as CSV.
The workspace audit log is the workspace-wide history of who did what and when. Every meaningful change — a member invited, a connector added, a knowledge source synced, a file uploaded, a chat thread deleted — is written to it as an immutable event. Use it to answer "when did this change?", "who made this change?", and to hand a reviewer a CSV of a period's activity.
Prerequisites
- The
workspace:read_auditpermission — in practice a workspace owner or admin. Members without it see an Audit Log access-denied panel instead of the table. - Nothing to configure: the log fills itself as the workspace is used. A brand new workspace shows only its own creation events.
Read the log
-
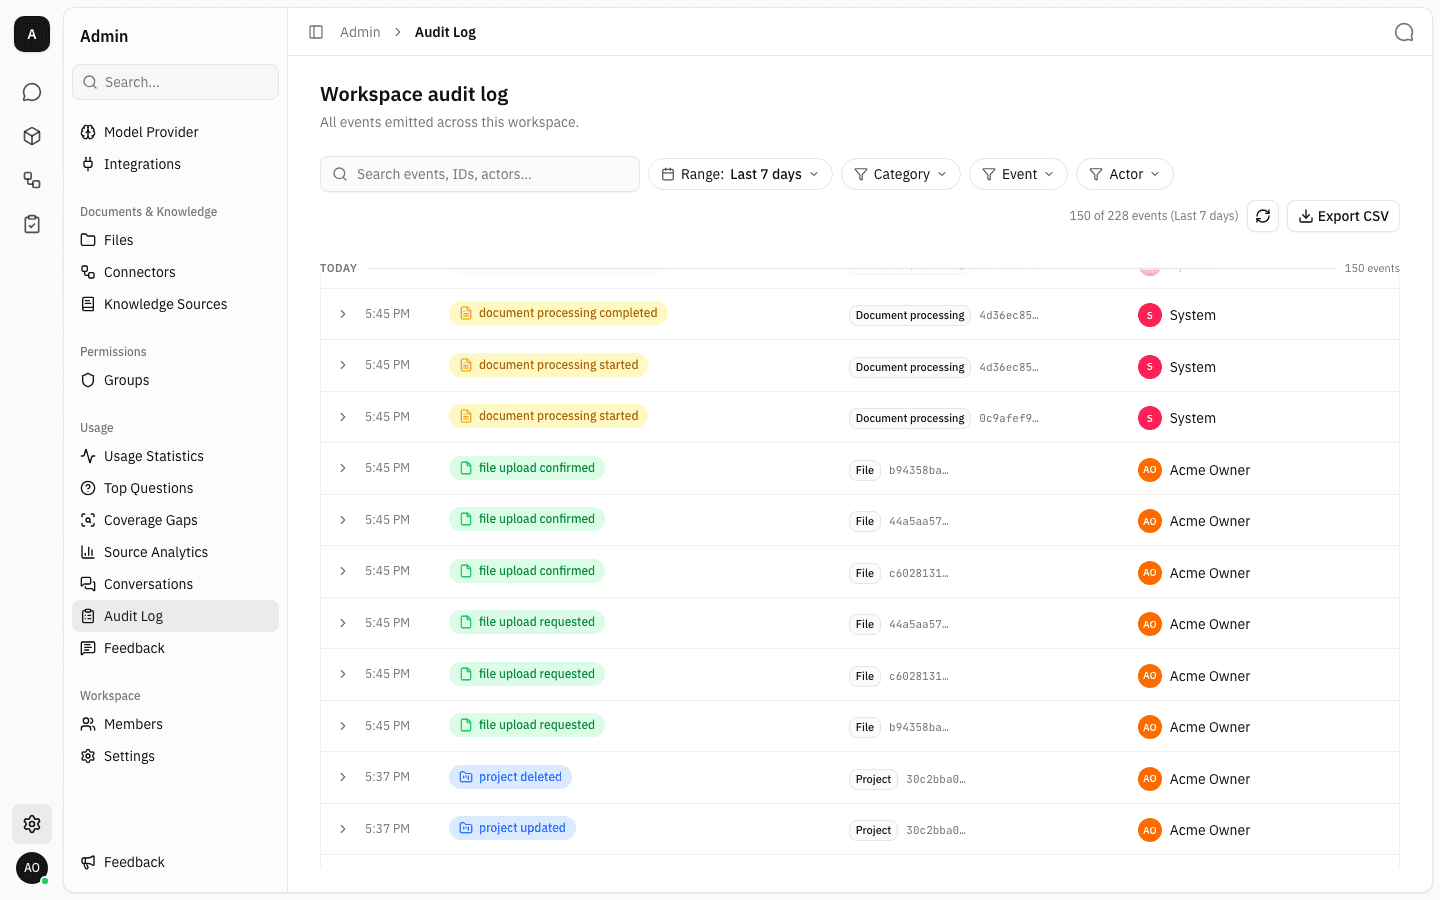
Open Admin → Audit Log in the left sidebar. The page opens on the last 7 days, newest event first, grouped under a day heading (
TODAY,YESTERDAY, then the weekday and date). The counter above the table reads loaded of total for the period, so50 of 228 events (Last 7 days)means 228 events exist in the range and the first 50 are on screen.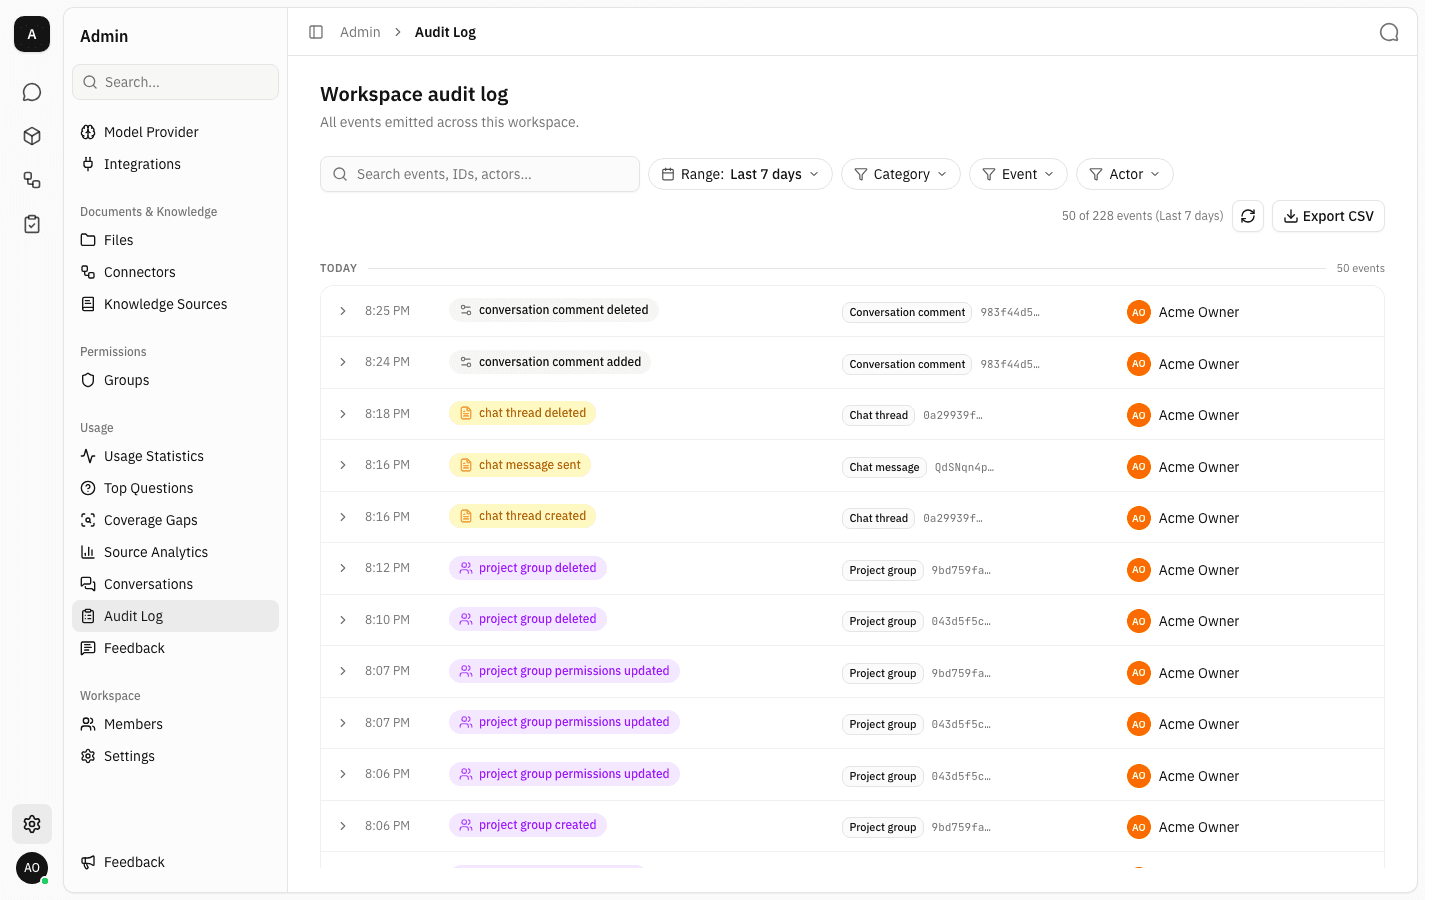
Each row carries four things: the time, a colour-coded category badge naming the event type, the entity the event happened to (its type and a shortened id), and the actor who caused it. Events raised by background processing rather than a person are attributed to System.
-
Click any row to expand it. The detail strip repeats the Event ID, the full Occurred timestamp and the Actor ID, and below it the complete event record is shown as JSON — including the
datapayload specific to that event type. Copy JSON puts the whole record on the clipboard, which is the quickest way to attach one event to a ticket. Click the row again to collapse it.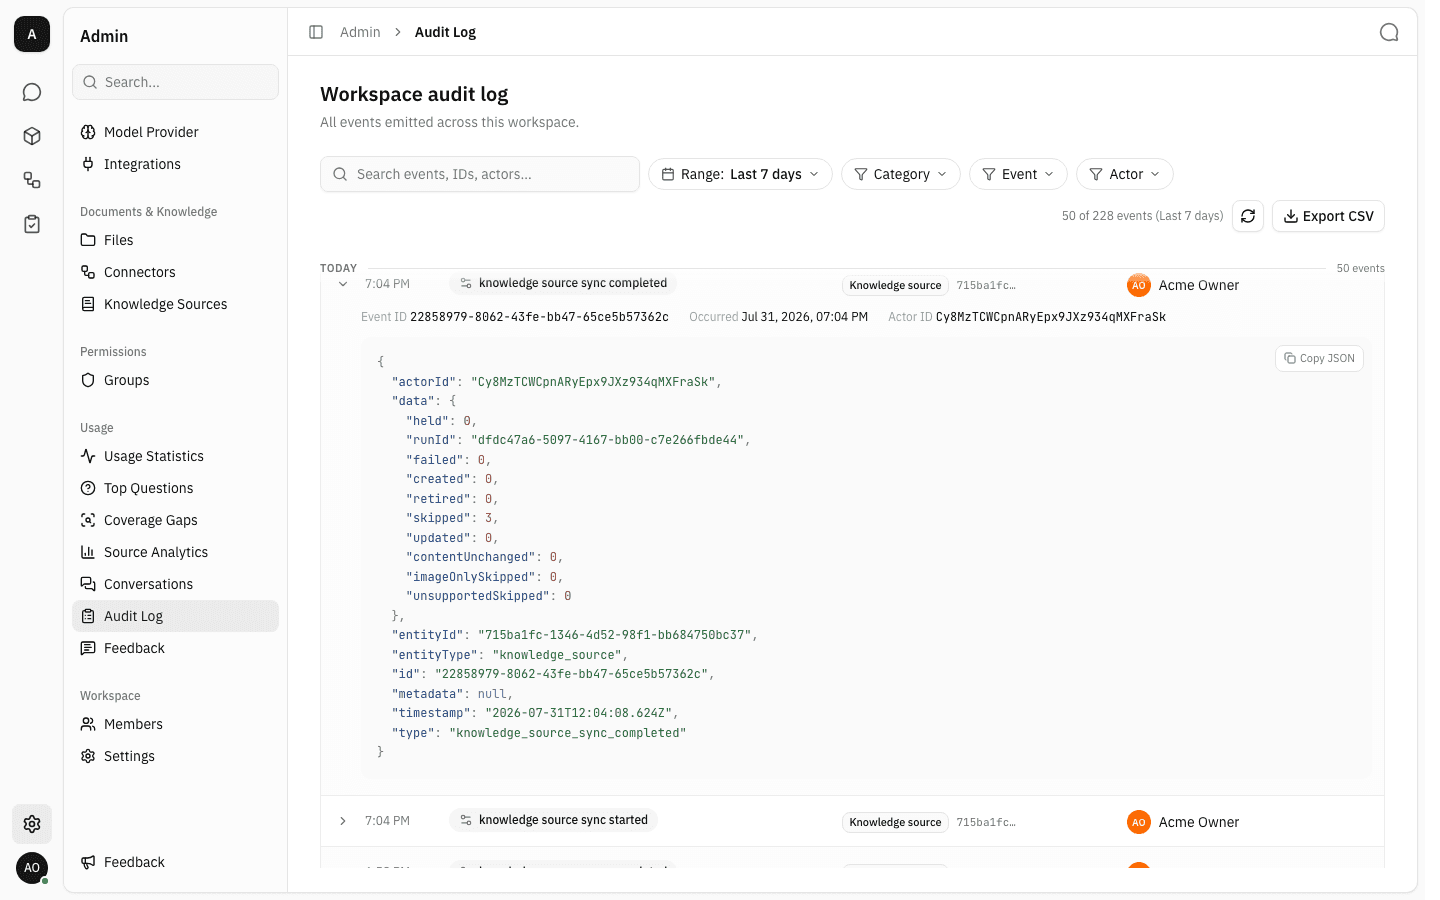
Narrow the period
-
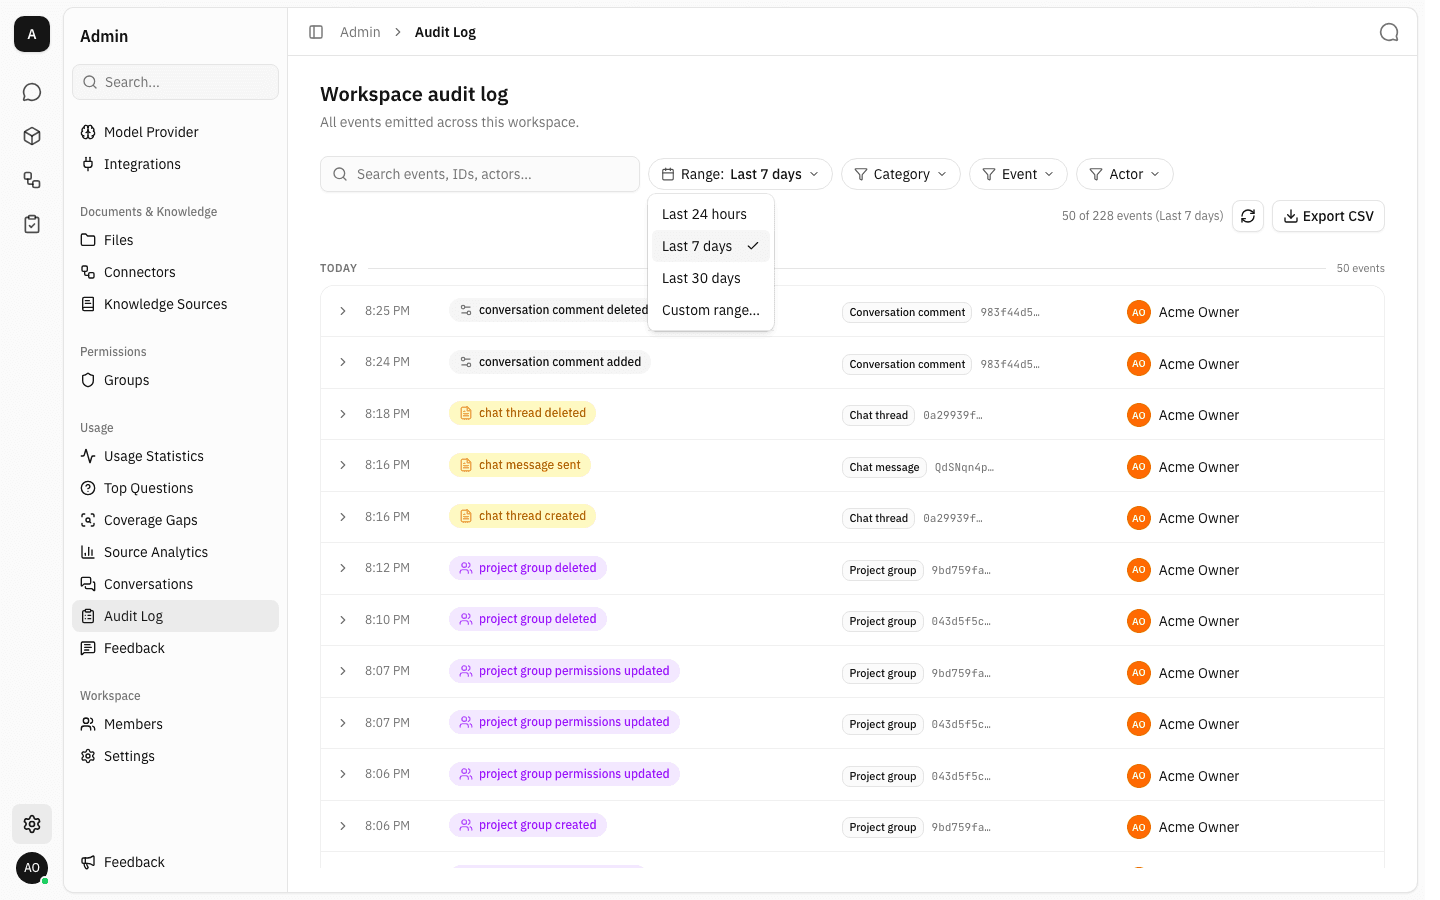
Click the Range chip. Three presets — Last 24 hours, Last 7 days, Last 30 days — are relative to the moment you pick them.
-
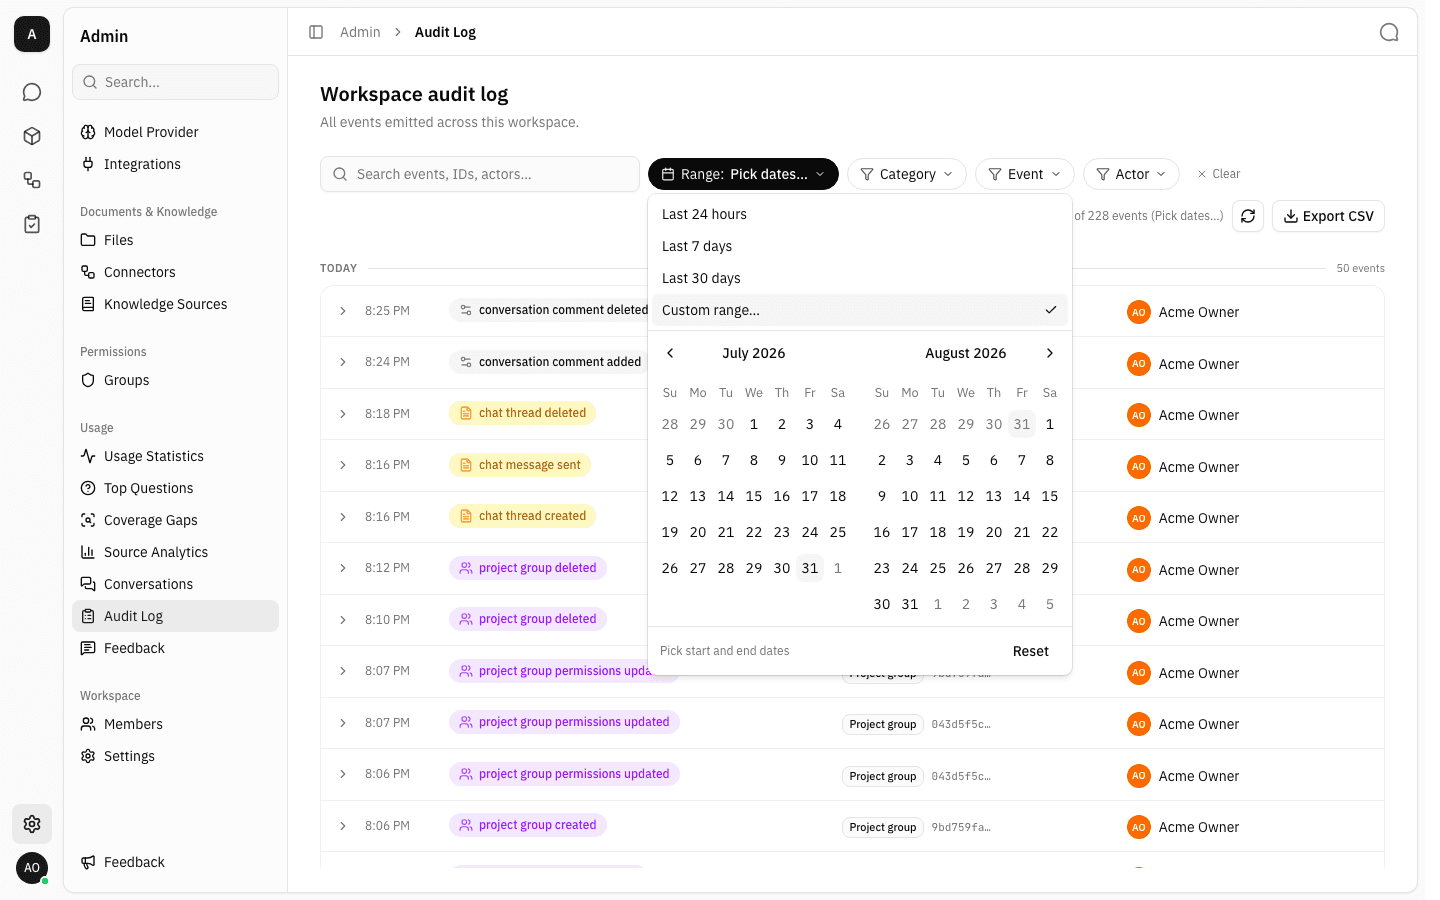
Choose Custom range… to get a two-month calendar instead. Click a start date then an end date; the chip switches to show the chosen span, and Reset returns the page to Last 7 days.
Filter by category, event type or actor
-
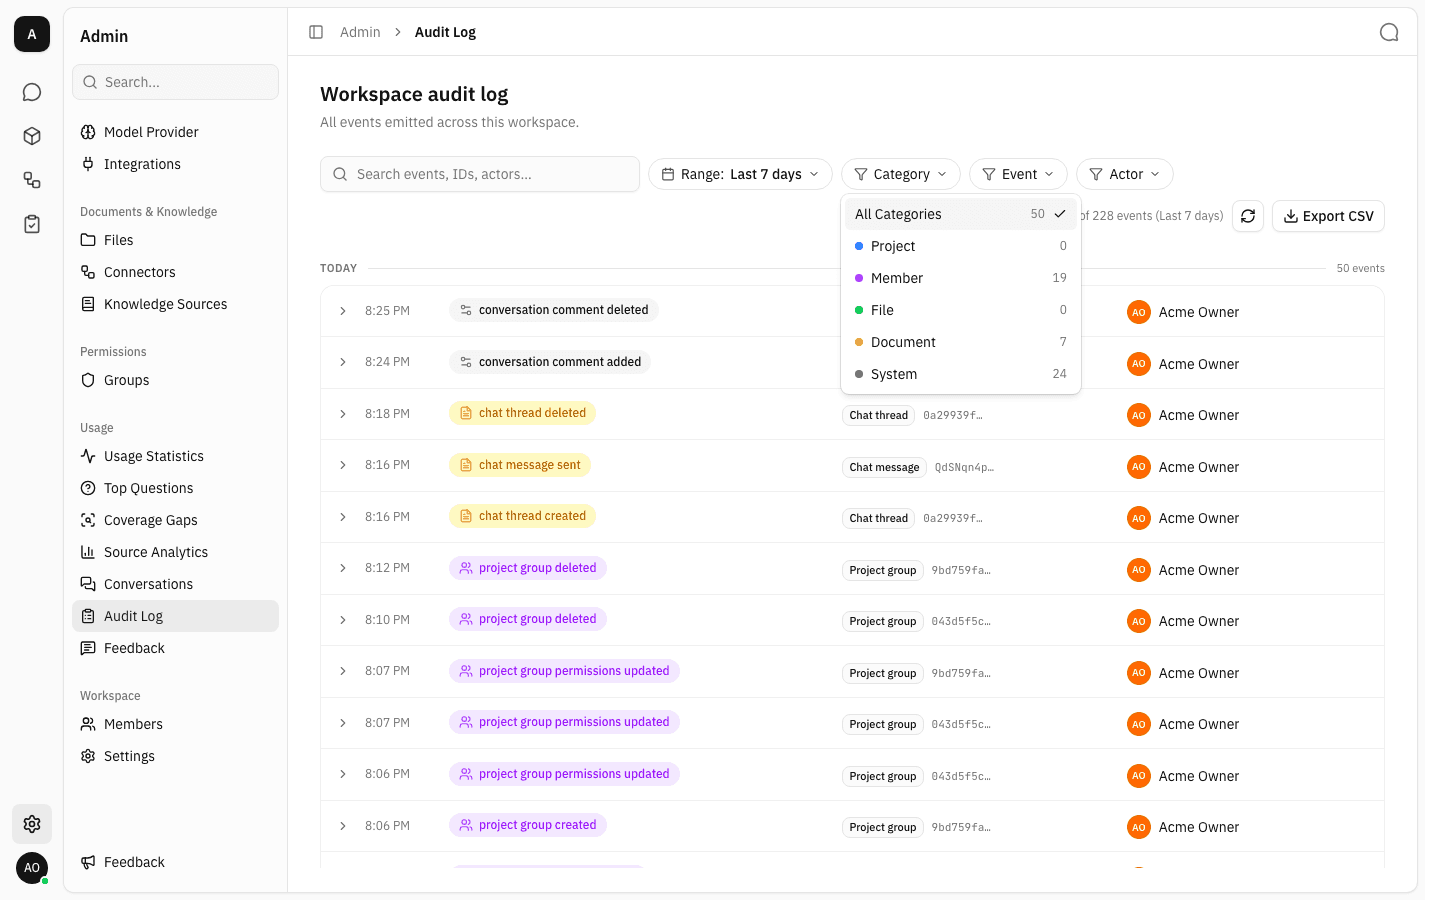
The Category chip groups the event types into five buckets — Project, Member, File, Document and System — and shows how many of the currently loaded events fall into each. The counts move as you load more pages, so treat them as a facet over what is on screen, not over the whole period.
-
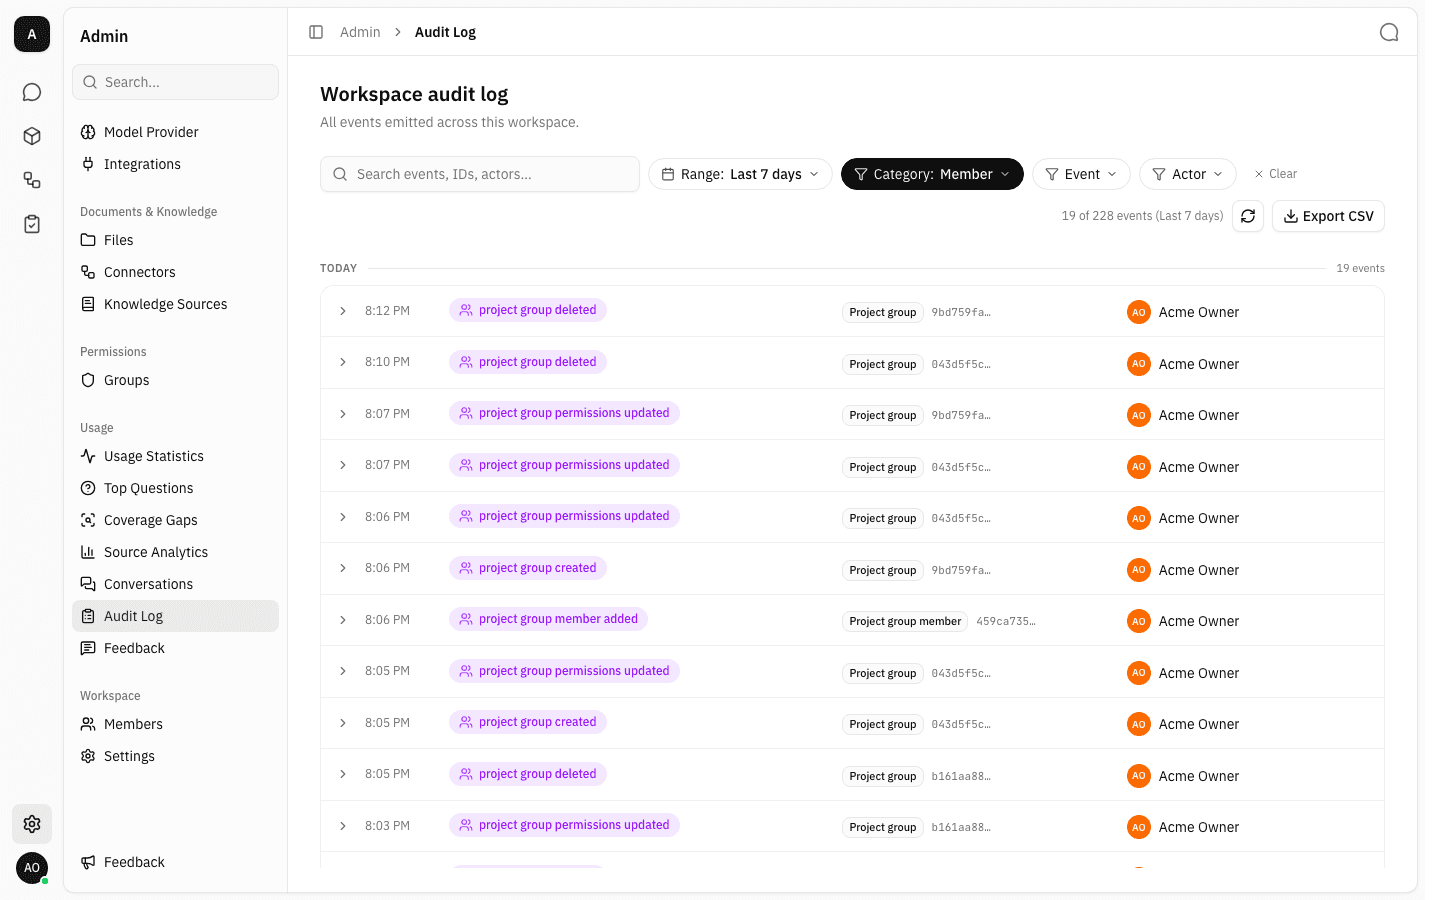
Pick a category to keep only its rows. Here Member leaves the 19 group and membership events out of the 50 that were loaded.
-
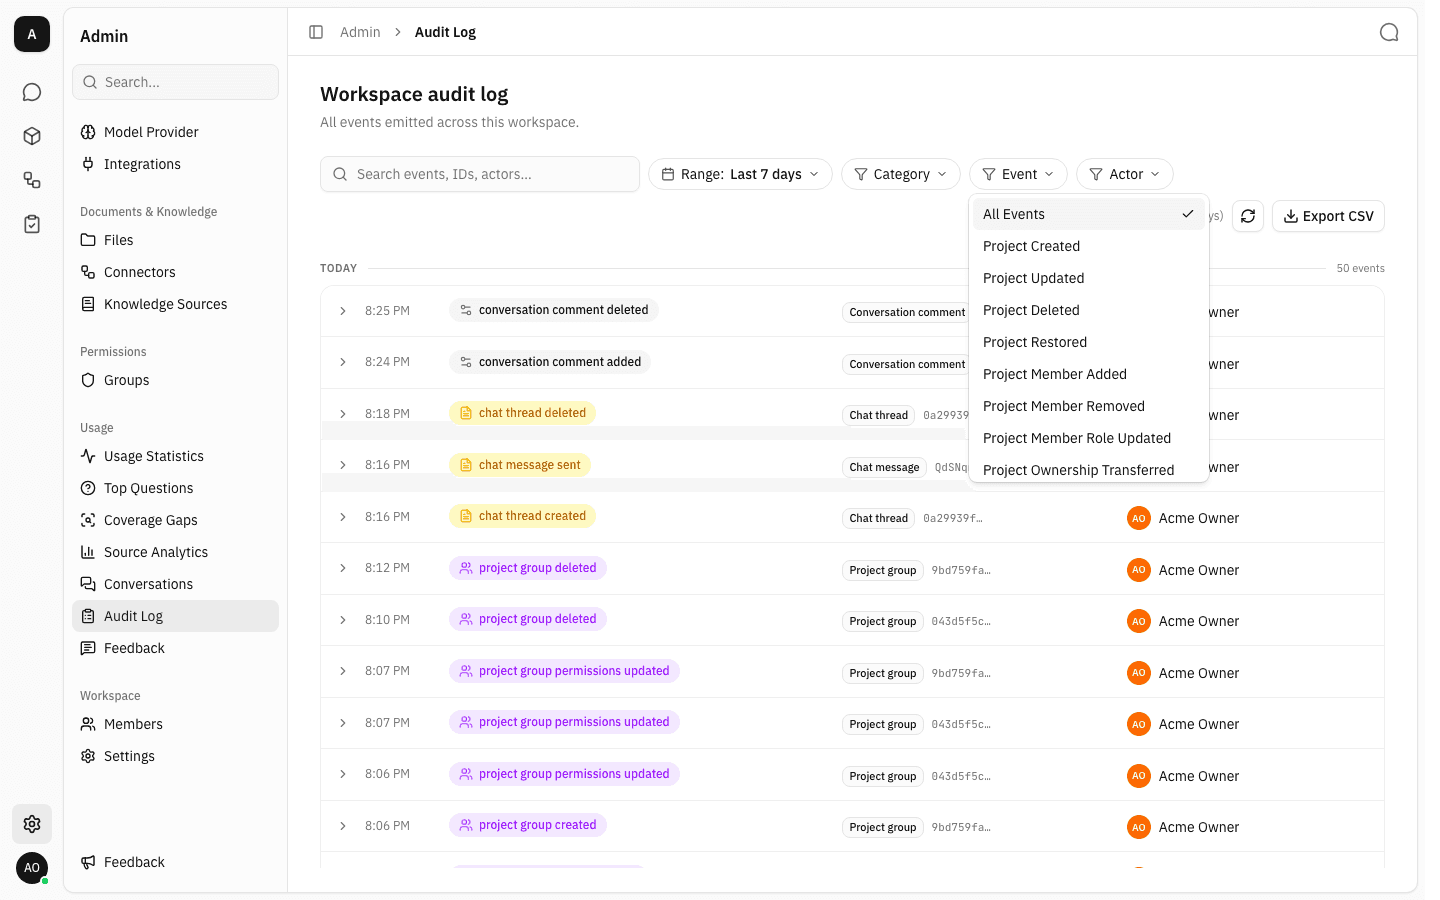
The Event chip is the precise version of the same idea: one named event type at a time, from projects and files through membership, groups, chat and document processing.
-
Choosing an event type re-queries the period rather than filtering what is already loaded, so the counter now reports the true total for that type —
6 of 6 events. Expanding one of these invitation events shows the invited address and the role it was sent for.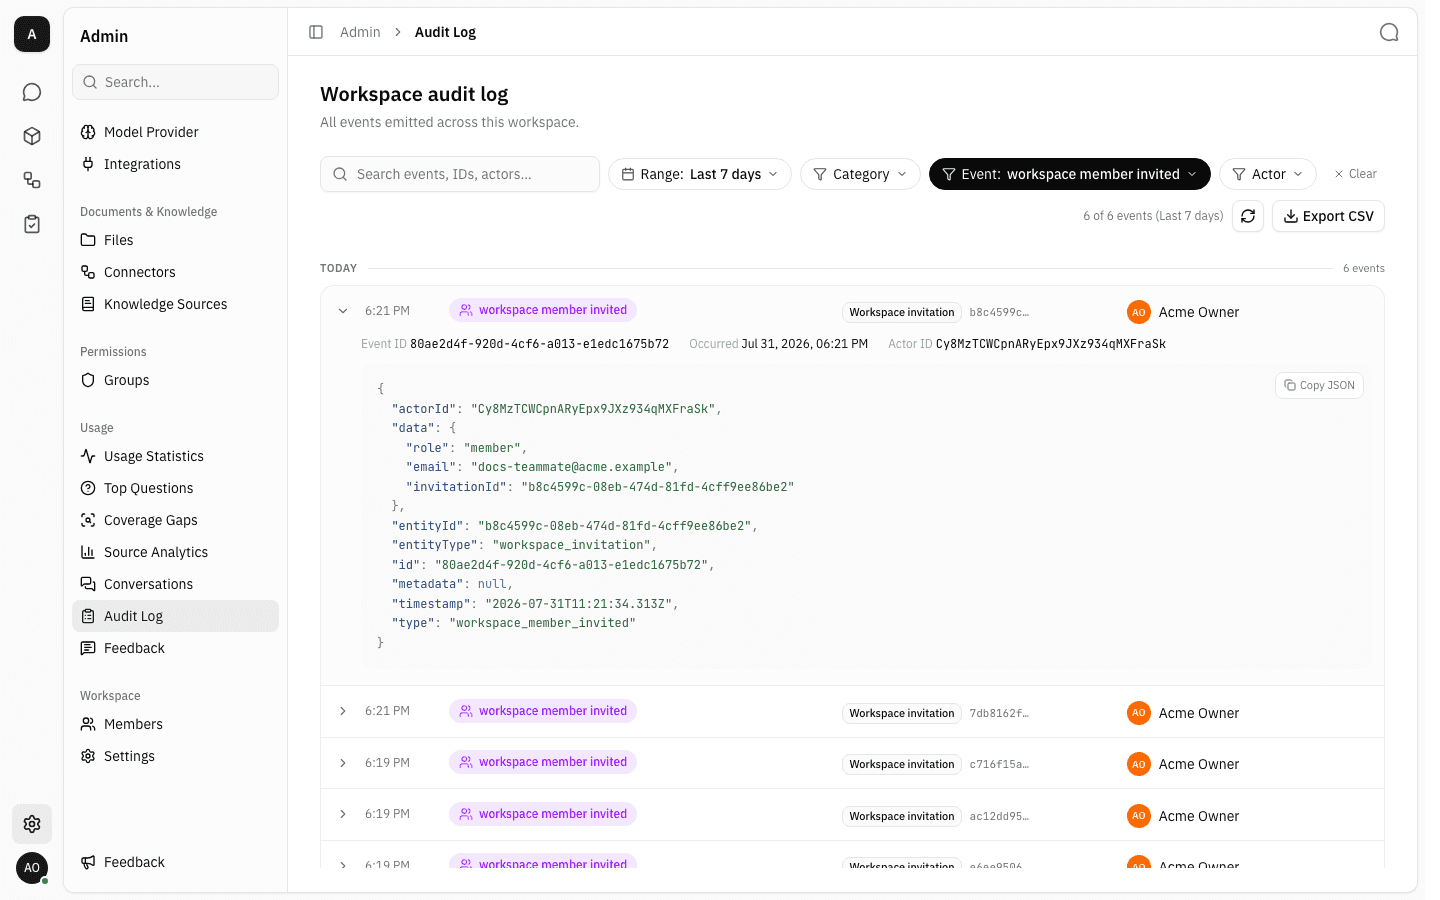
-
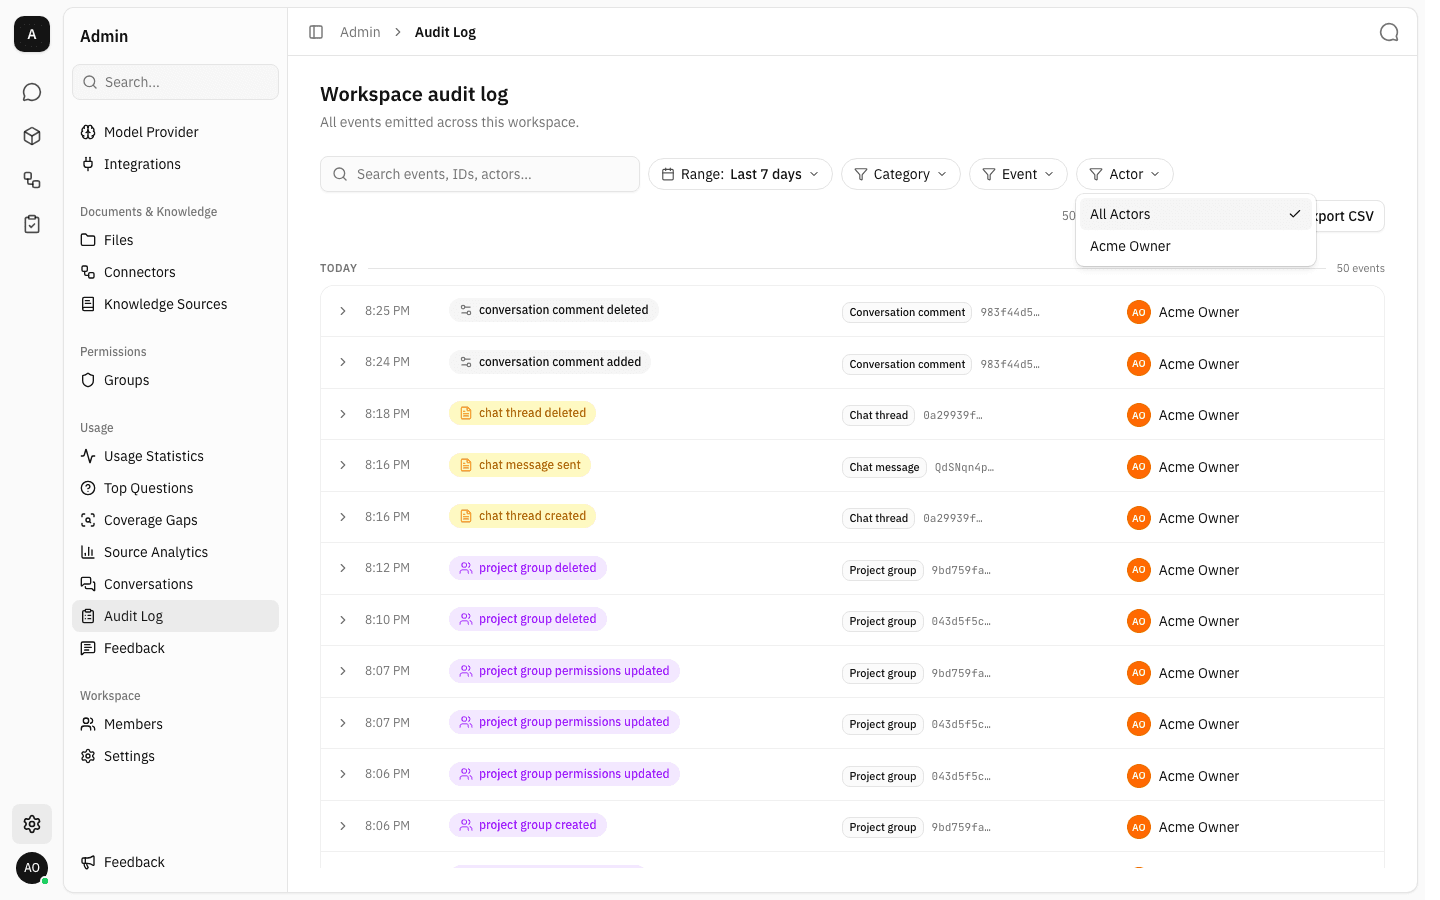
The Actor chip lists the workspace members who can appear as an actor, so you can follow one person's activity through the period.
Search within the results
-
The search box matches free text against the event type, entity type and id, the actor's name and the JSON payload — useful for tracking one entity id across several event types. Searching
connectorsurfaces the add, update and delete of the same connector.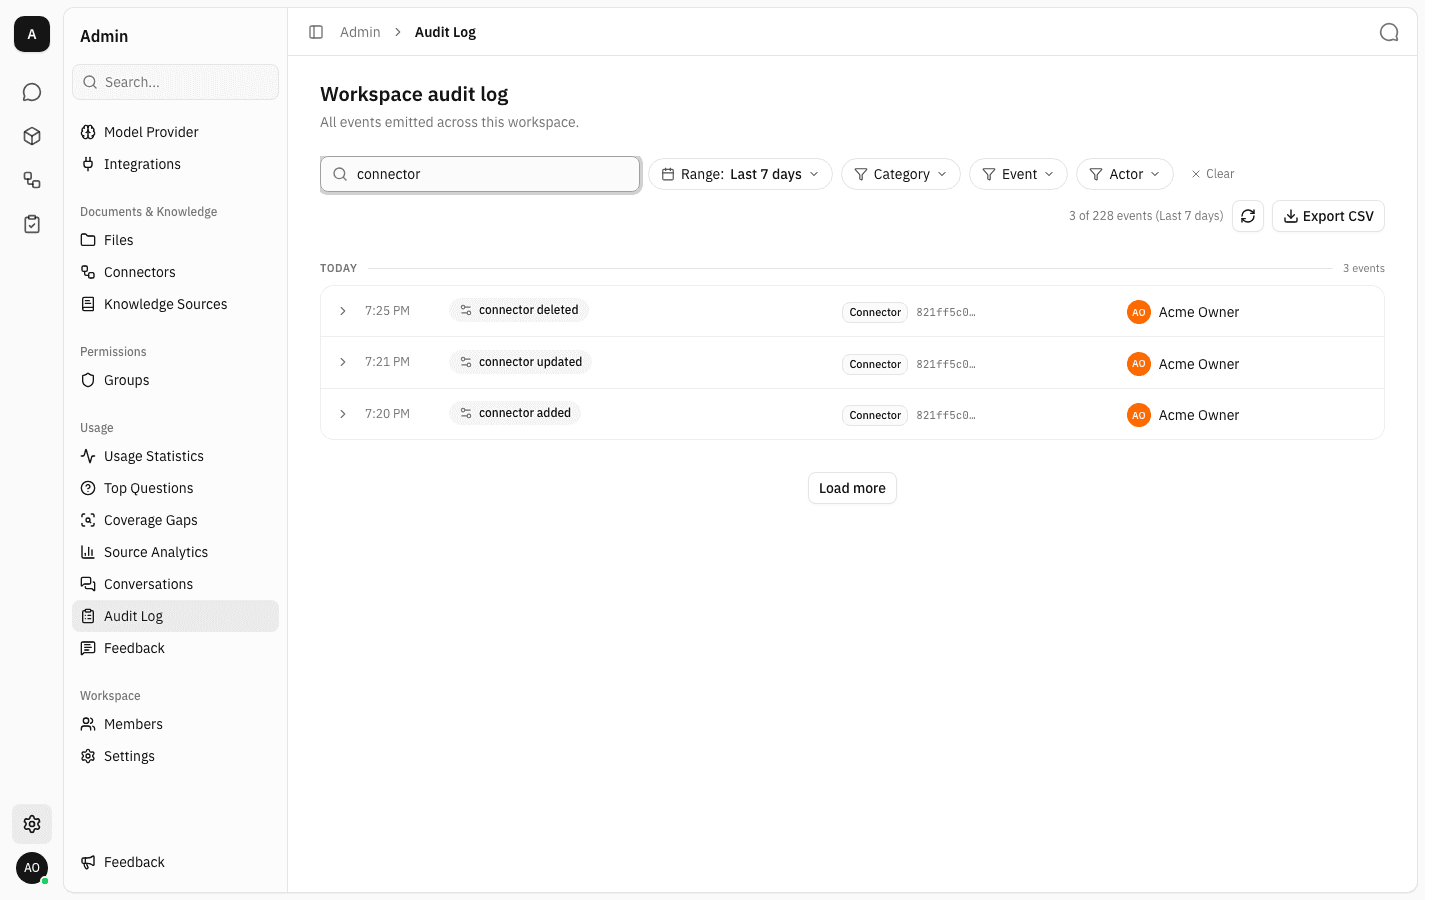
-
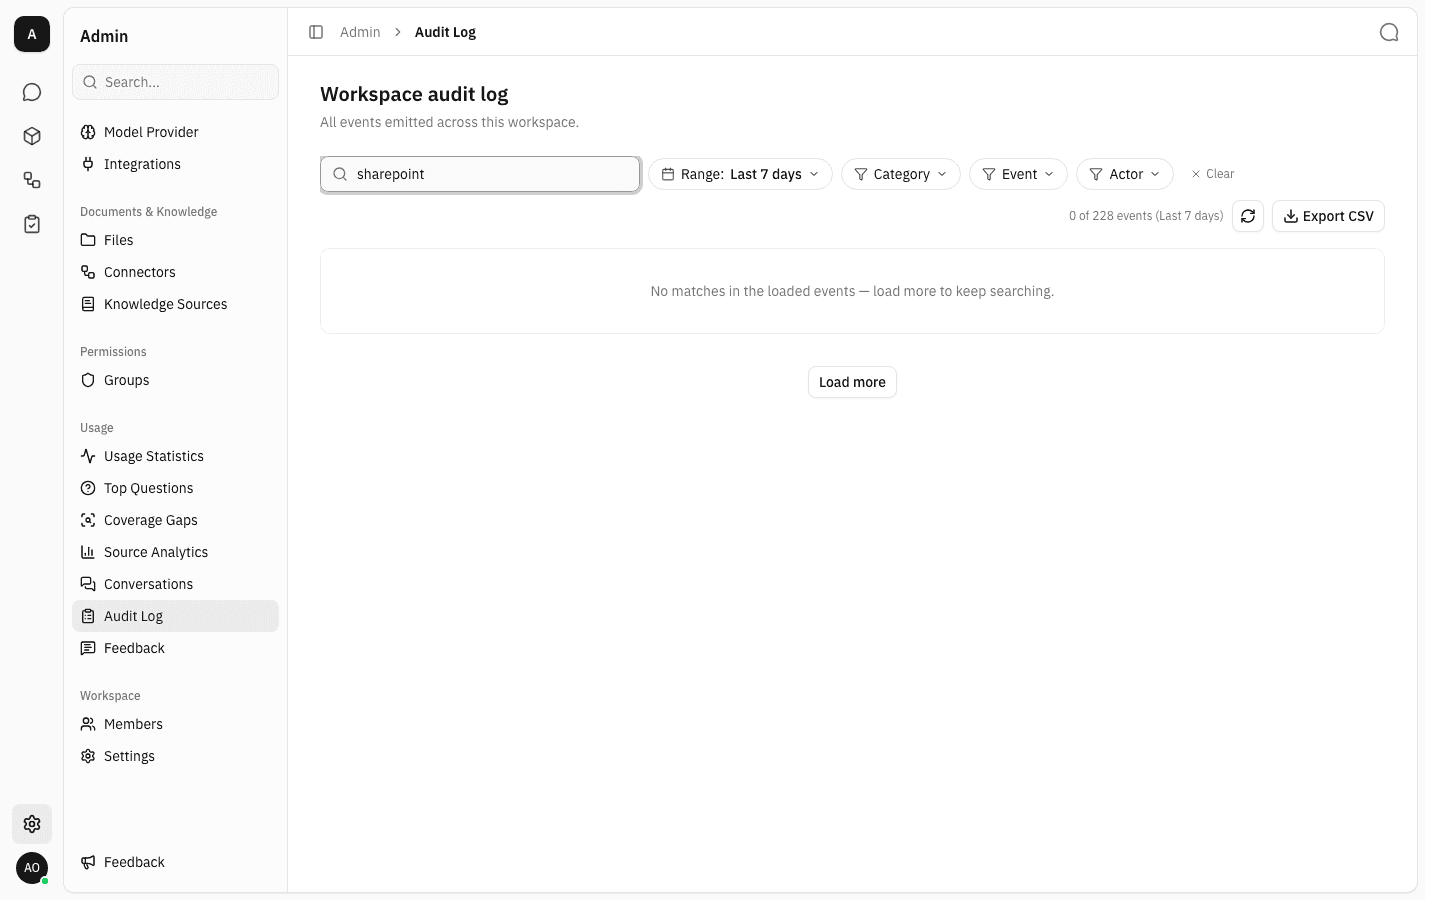
Search runs over the loaded events only. When nothing on screen matches but more pages exist, the log says so and invites you to load more instead of claiming there are no results.
-
When the period genuinely holds nothing — here the
project restoredevent type, which has never fired — the page shows the empty state. Widen the range or drop a filter from here.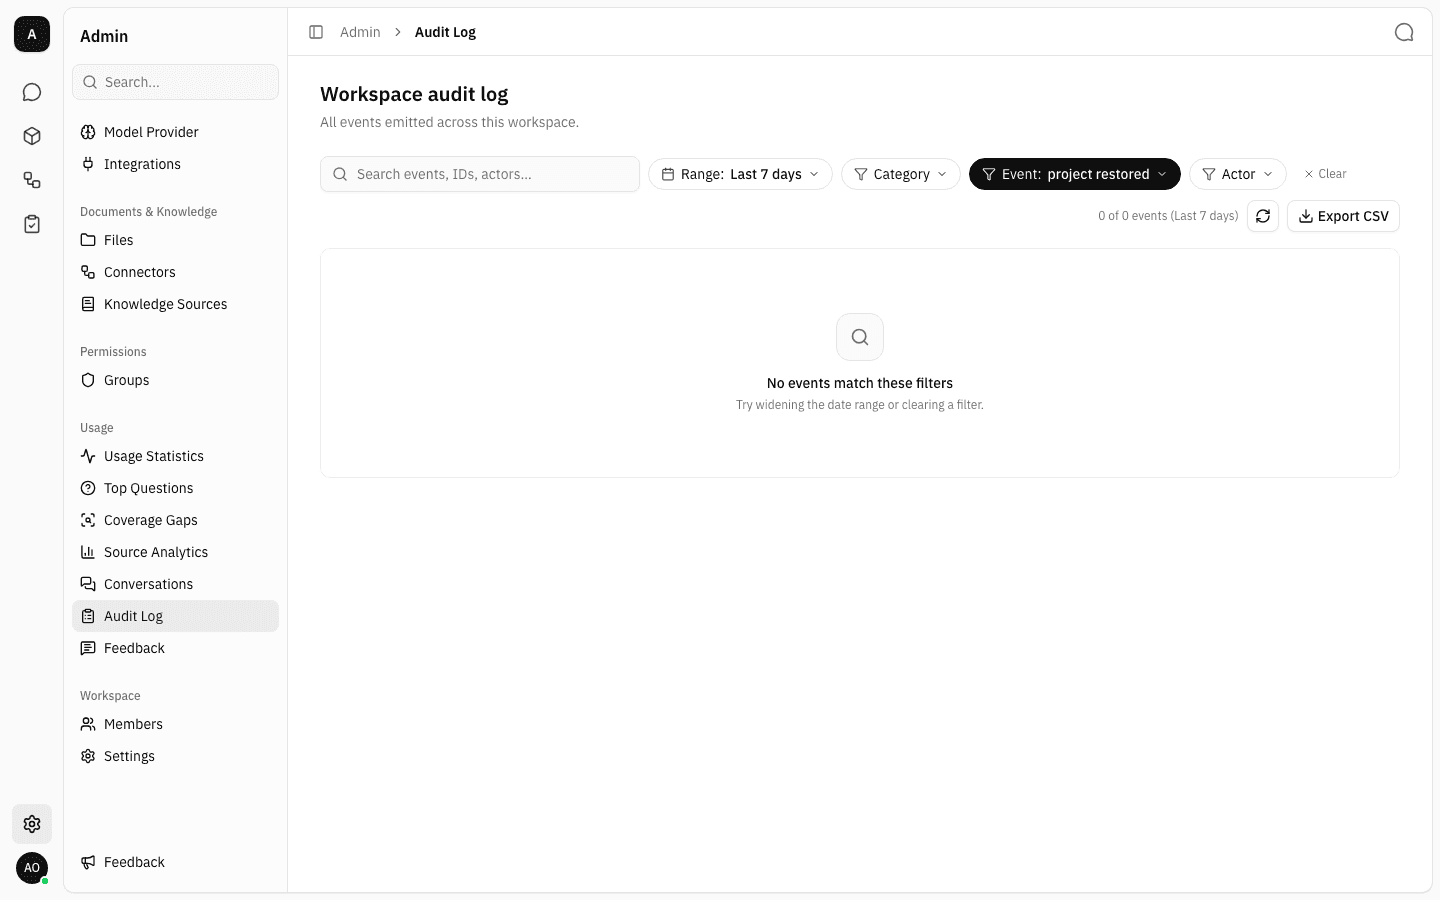
Clear next to the chips resets the range, all three filters and the search box in one click.
Load more and export
-
The log pages in 50 events at a time. Scrolling to the bottom loads the next page automatically, and a Load more button is there for when you would rather click. The counter at the top tracks how much of the period is loaded.
-
Export CSV downloads the events for the current period and chip filters as
audit-log-<date>.csv, one row per event with the timestamp, type, entity, actor and the rawdatapayload. The export loads every remaining page first, so on a busy period the button sits on Exporting… for a moment — the file covers the whole period, not just what was on screen.
Notes
- Audit events are append-only: nothing in this view edits or deletes history, and there is no way to remove an event from the log.
- The Category and search filters work on the loaded rows in the browser; the Range, Event and Actor filters are applied by the server. That is why the counter's "of n" total only changes for the latter.
- The Event chip lists a fixed set of common event types. Some events that do appear in the log — connector and knowledge source changes, import policy updates, sync runs, review decisions — are not selectable there yet; reach them with the search box or the System category instead.
- Times are shown in the workspace's display time zone; the expanded JSON keeps the original UTC timestamp.
- Projects have their own scoped audit log covering only that project's events. Open a project and choose its Audit tab; the page works exactly as described here.